

Reference Tables
Every chart, map and table from the Reference Tables for Earth and Space Sciences in one place. Open any table to zoom, print or save it, then learn how to read each page on the exam.
Use the 2026 Revised Edition from the 2026-27 school year (the January 2027 exam is the first to use it). Page numbers below refer to it. The older Physical Setting/Earth Science booklet is different, and it included an equations page.
The tables
 Cross Section of Earth's Lower Atmosphere
 Emission Spectra of Some Elements from Stars
 Energy and Mineral Resources of New York State
 Generalized Cross Section of Earth's Surface and Interior
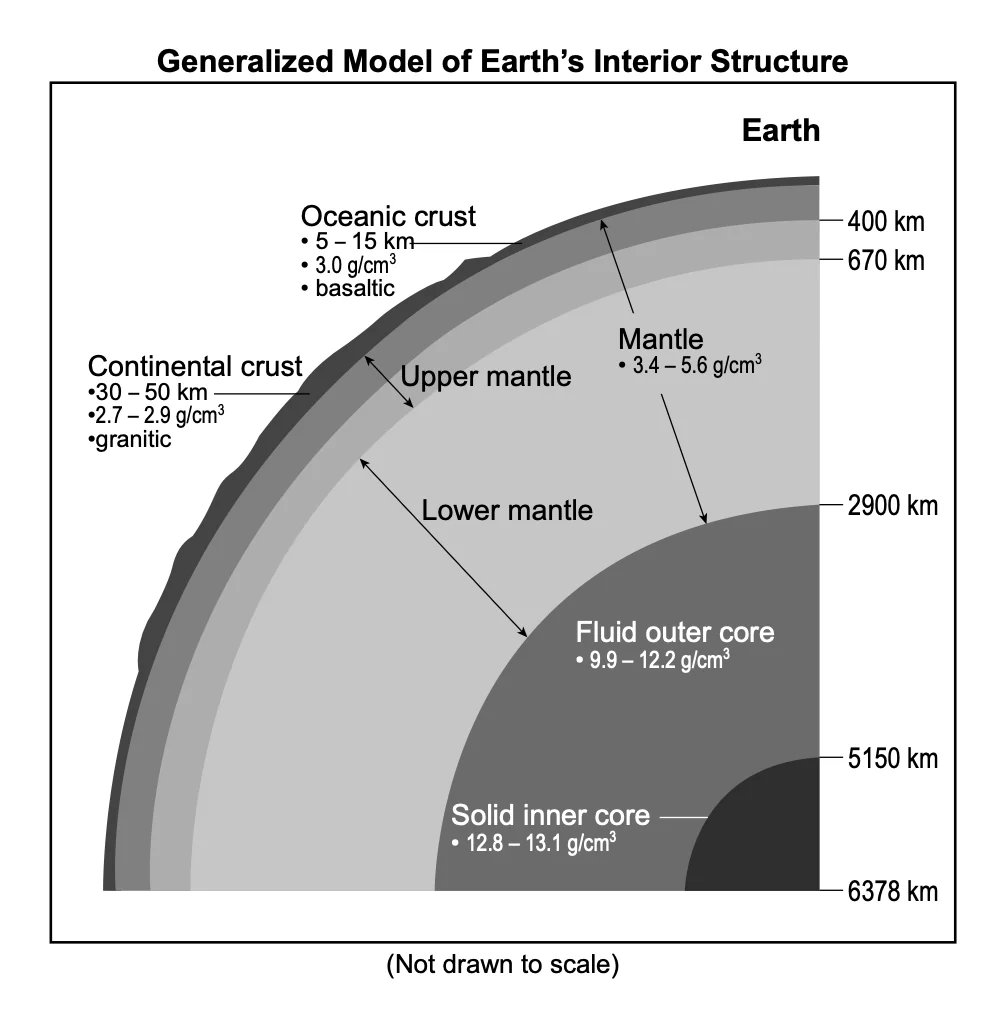
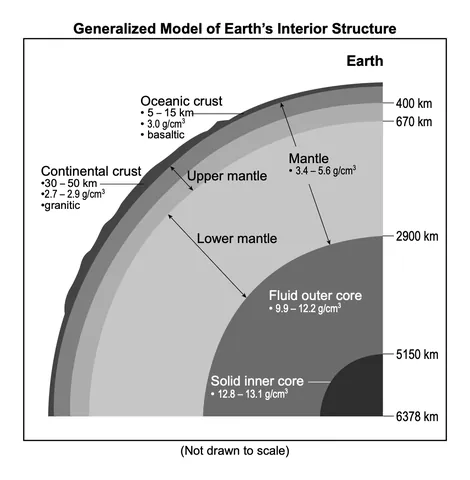 Generalized Model of Earth's Interior Structure
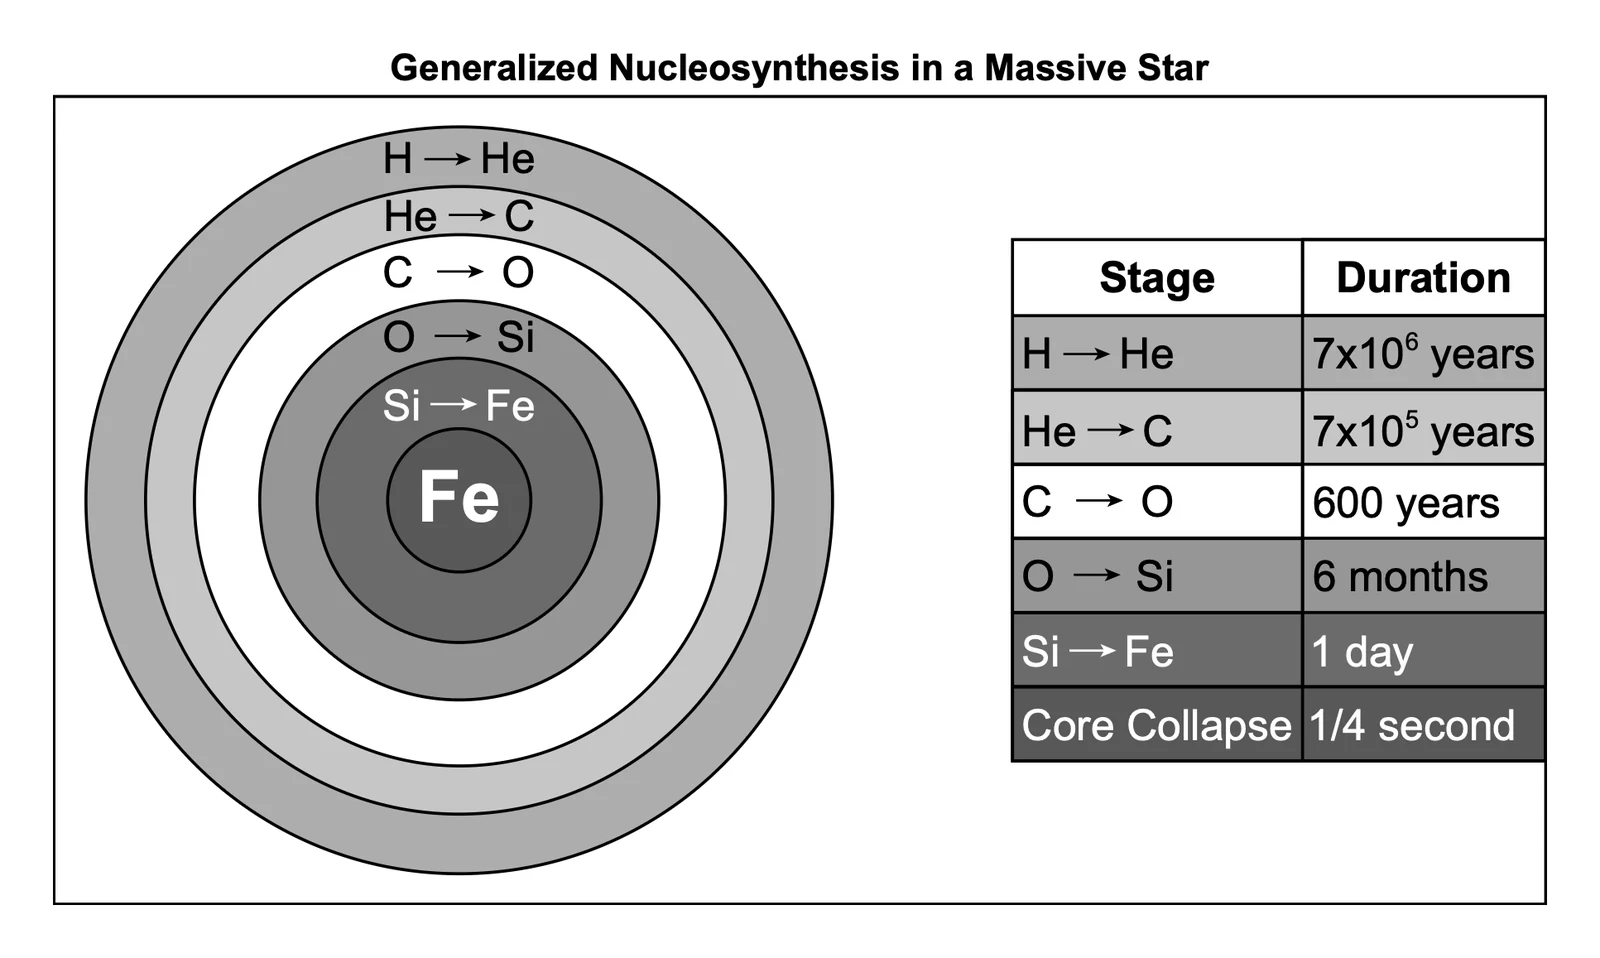
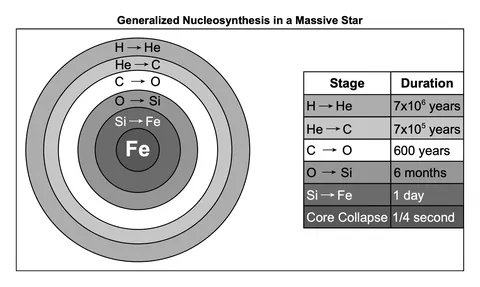 Generalized Nucleosynthesis in a Massive Star
 Generalized Portion of the Electromagnetic Spectrum
 Generalized Surface Bedrock Geology of New York State
 Geographic Province and Landscape Regions of New York State
 Geologic History of New York State
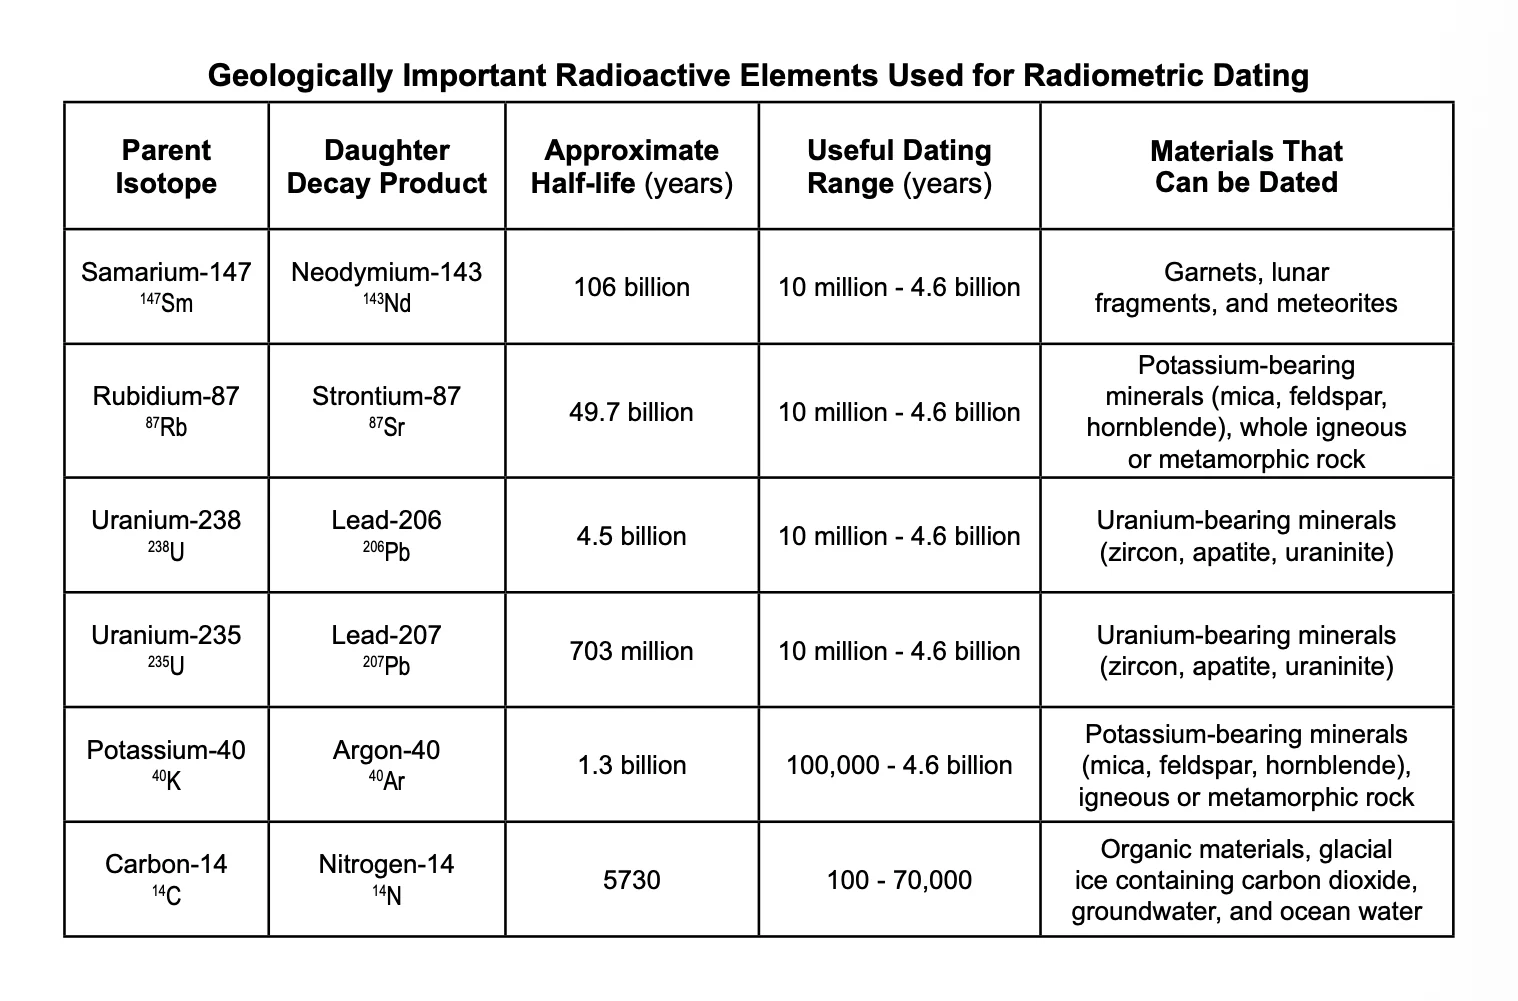
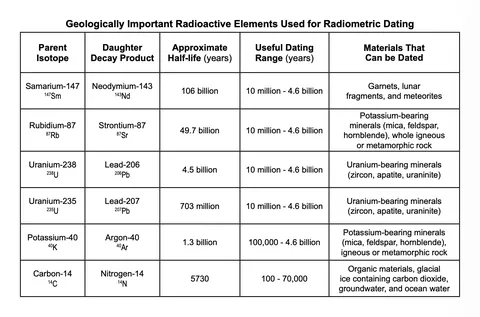 Radioactive Elements Used for Radiometric Dating
 Global Tectonic Activity of the Last One Million Years
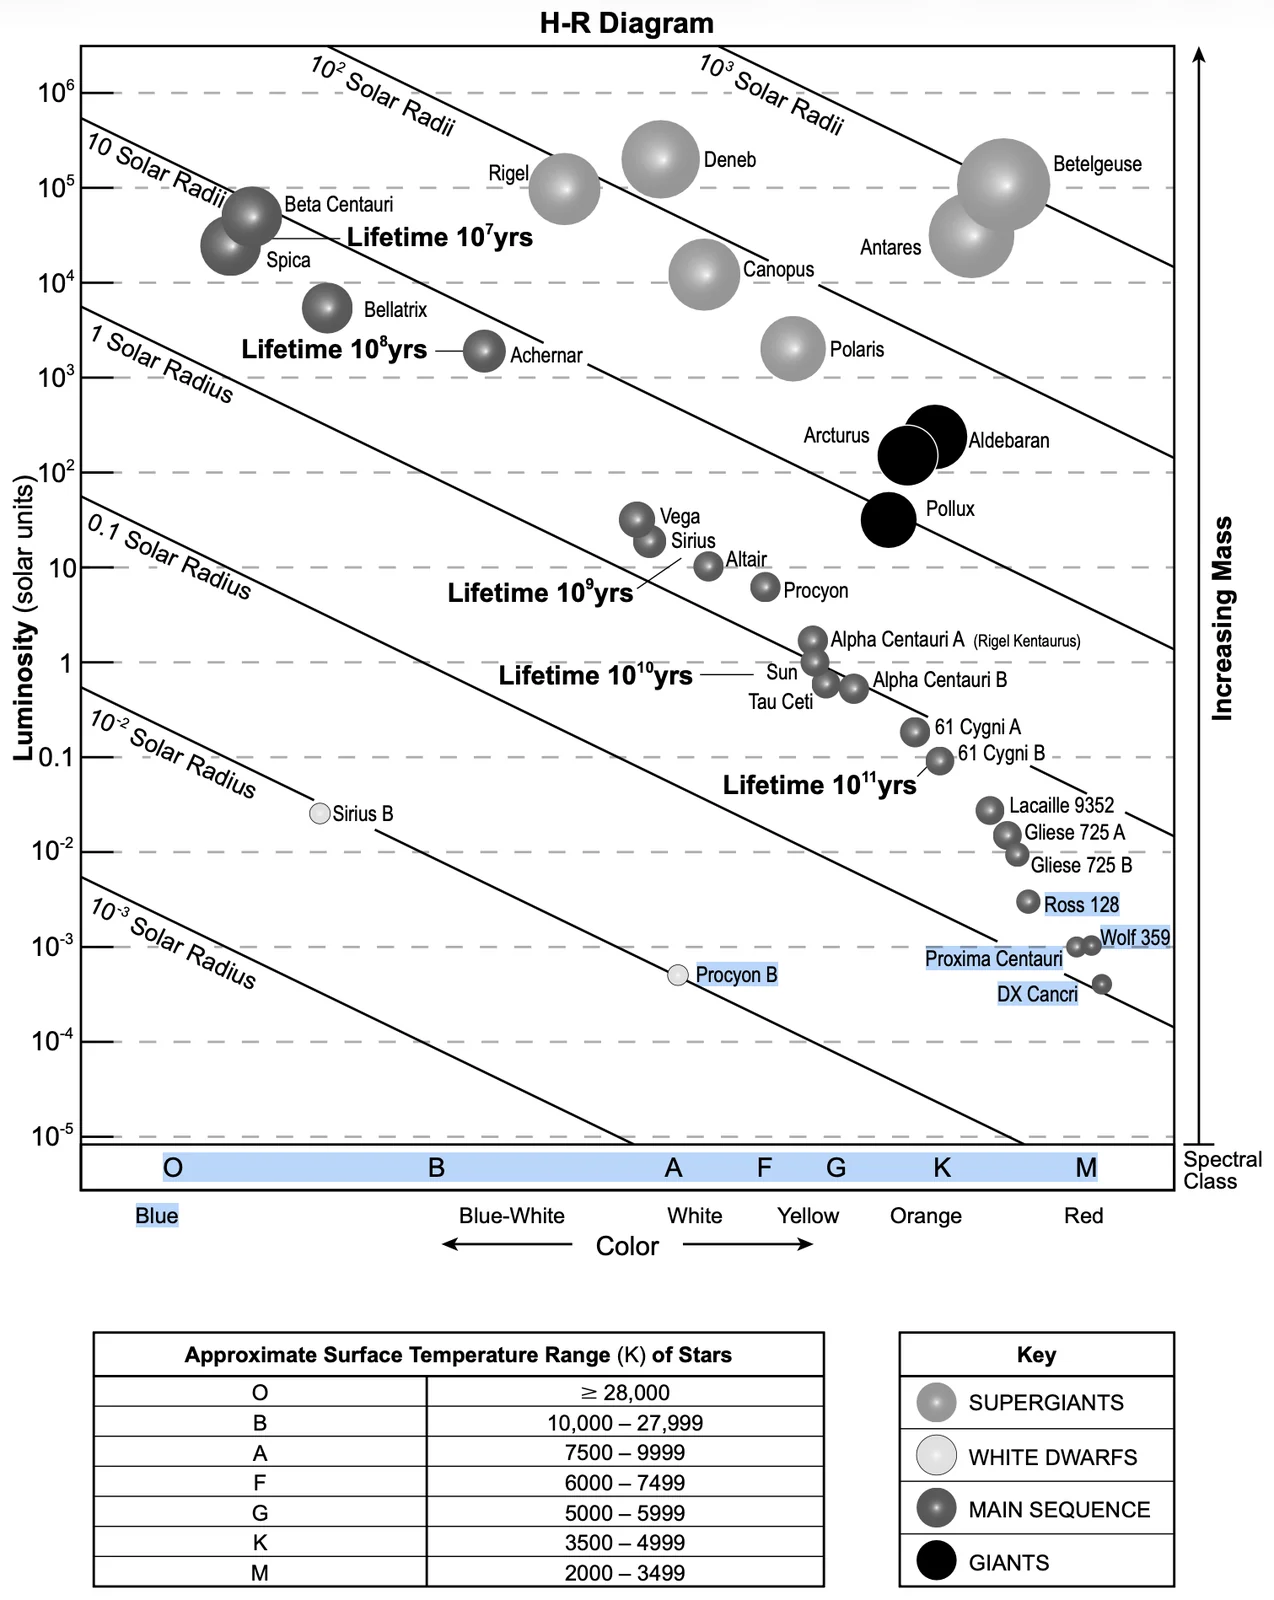
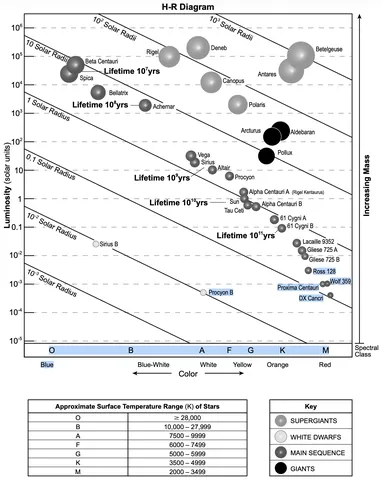 H-R Diagram
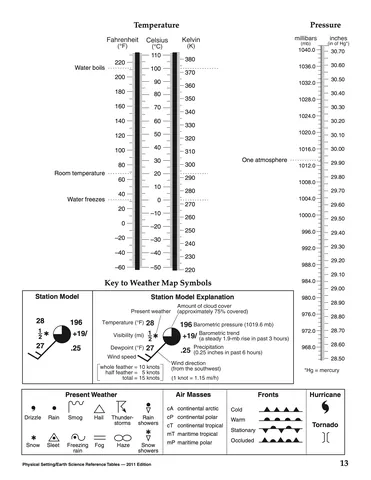
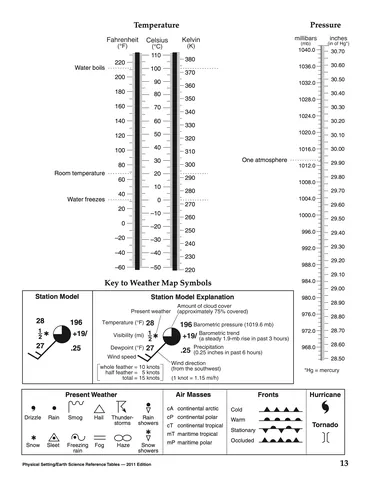
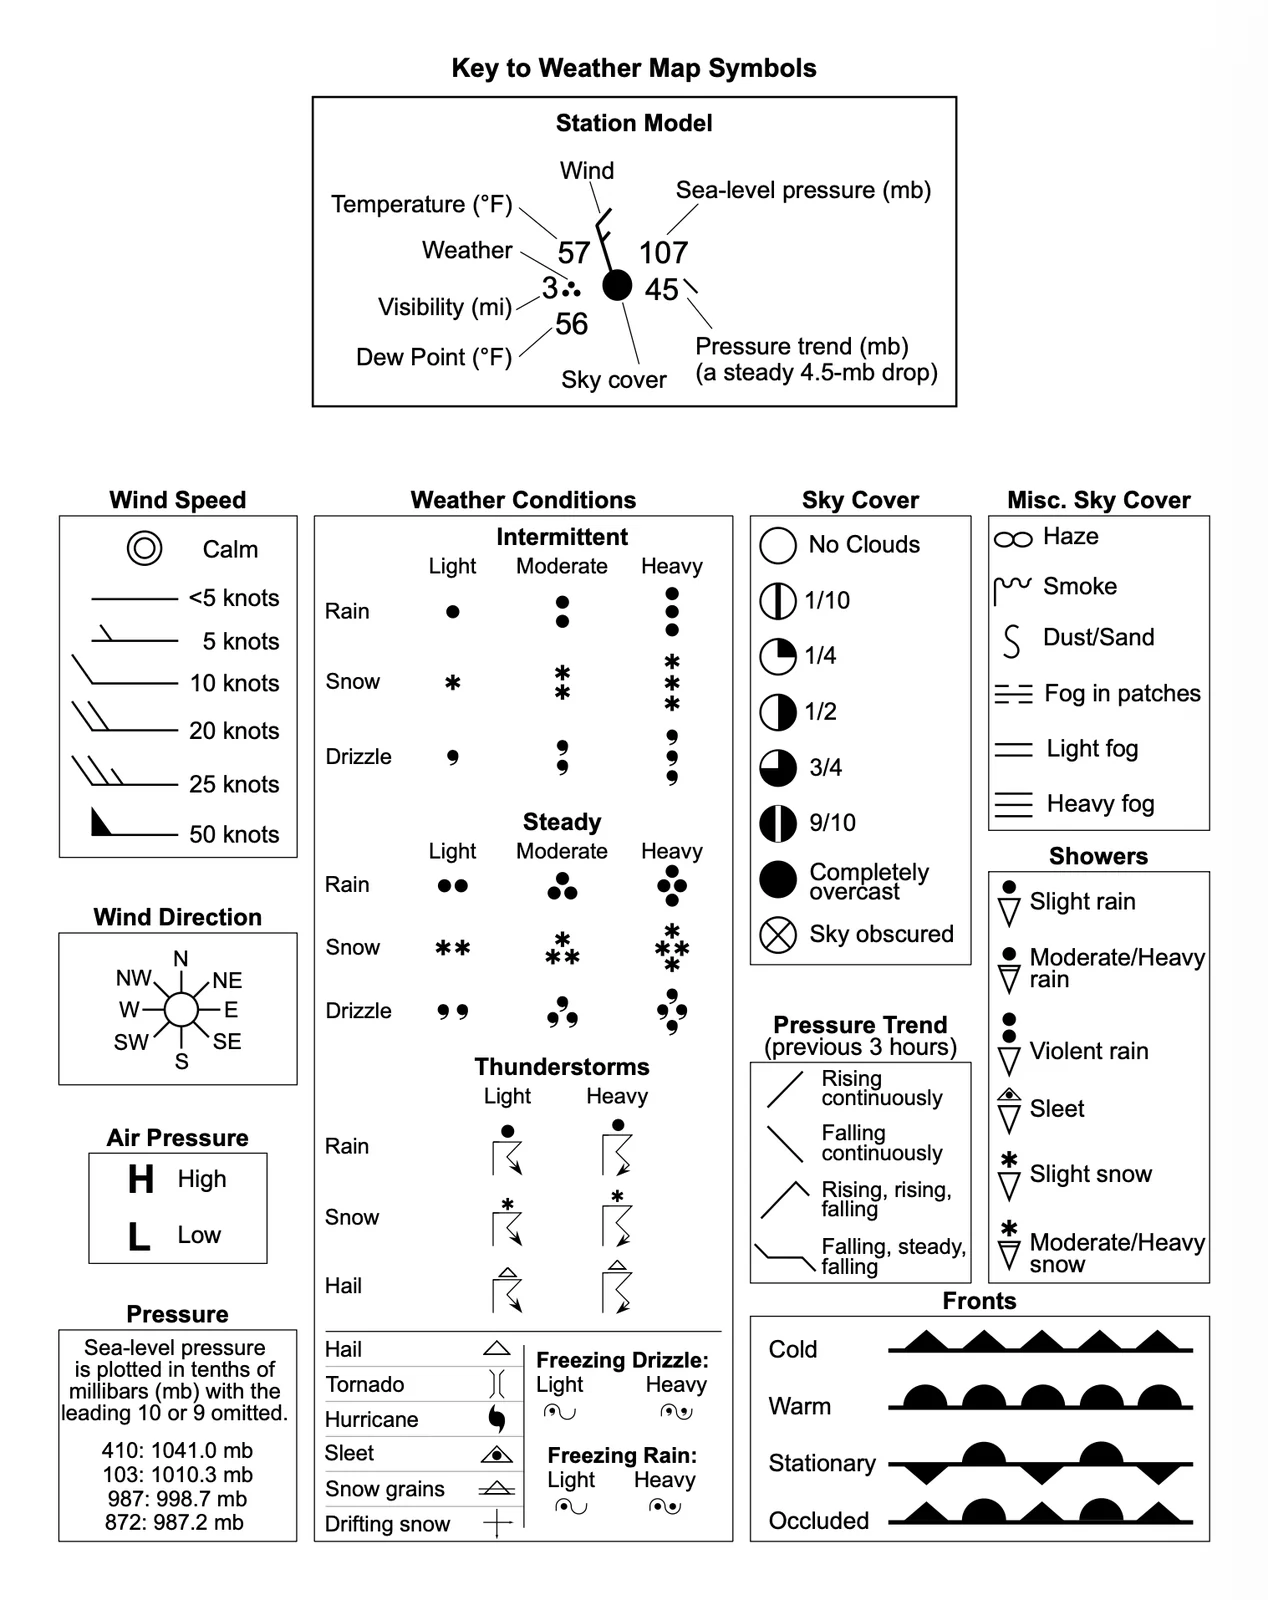
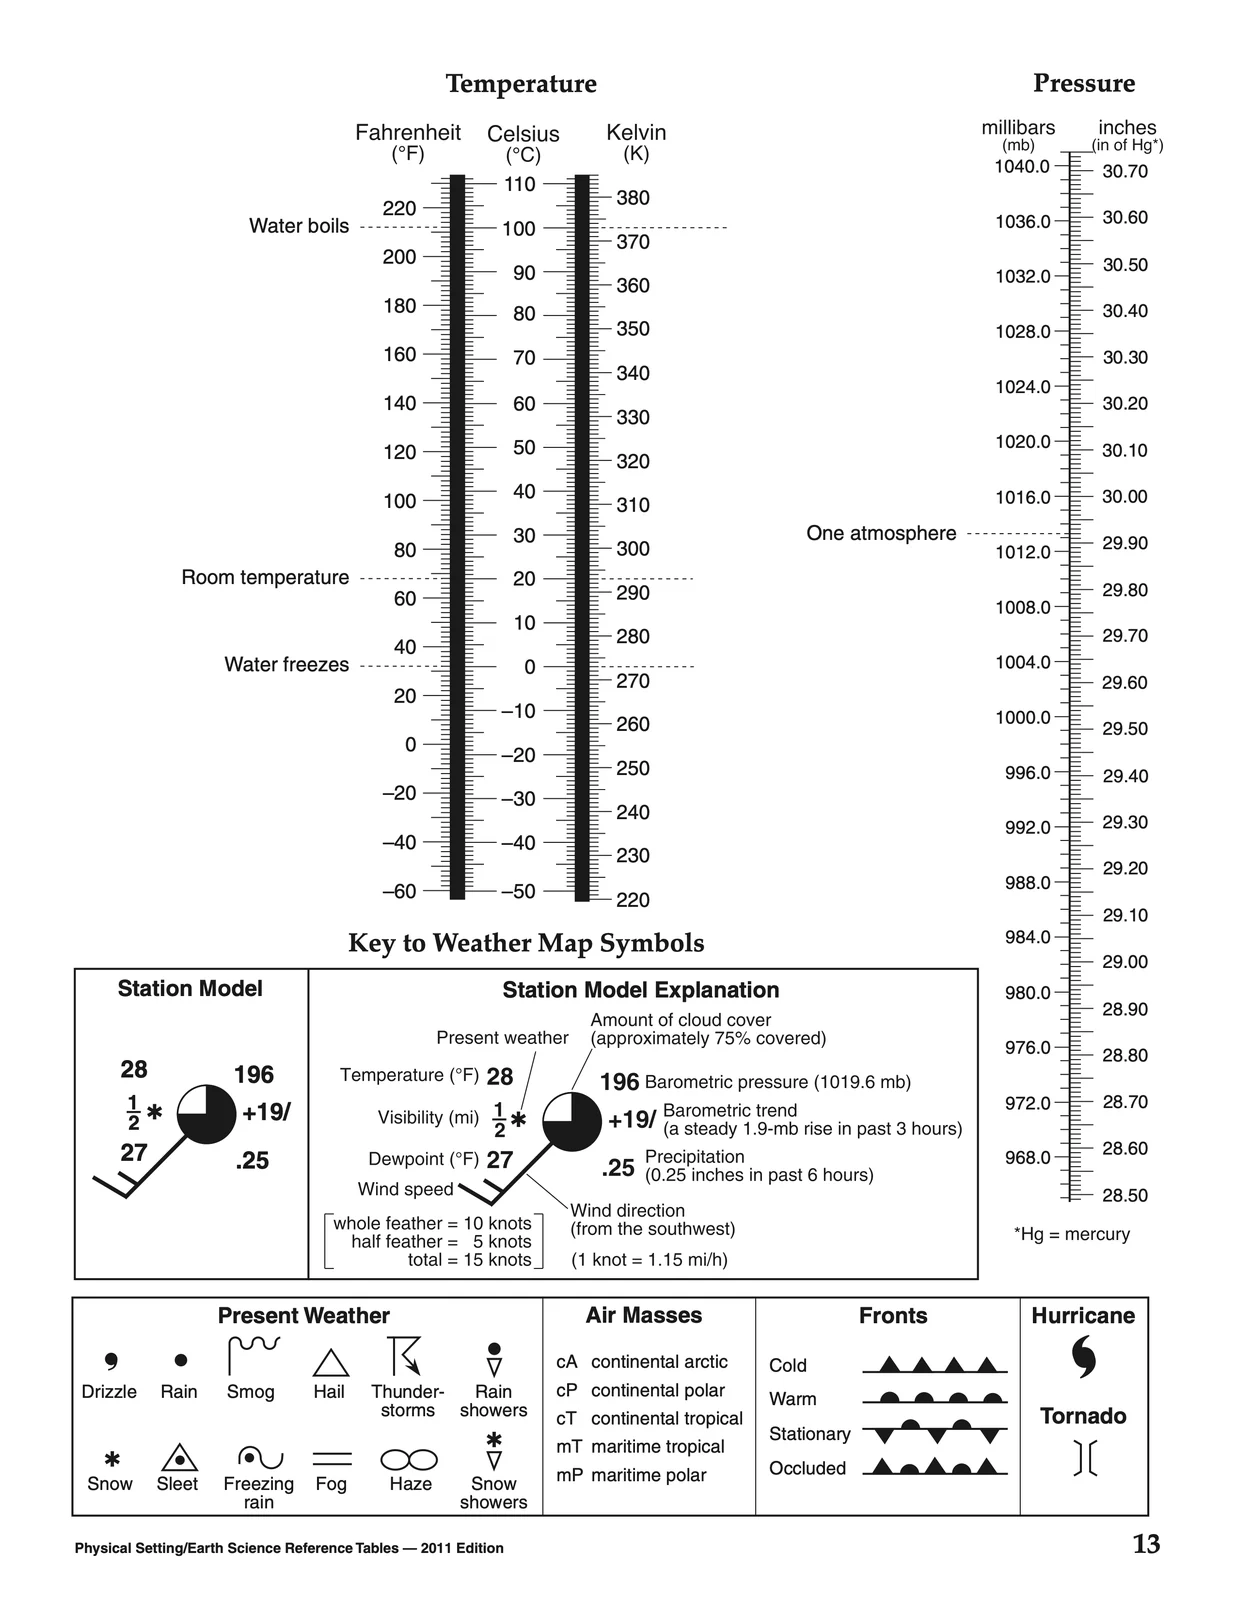
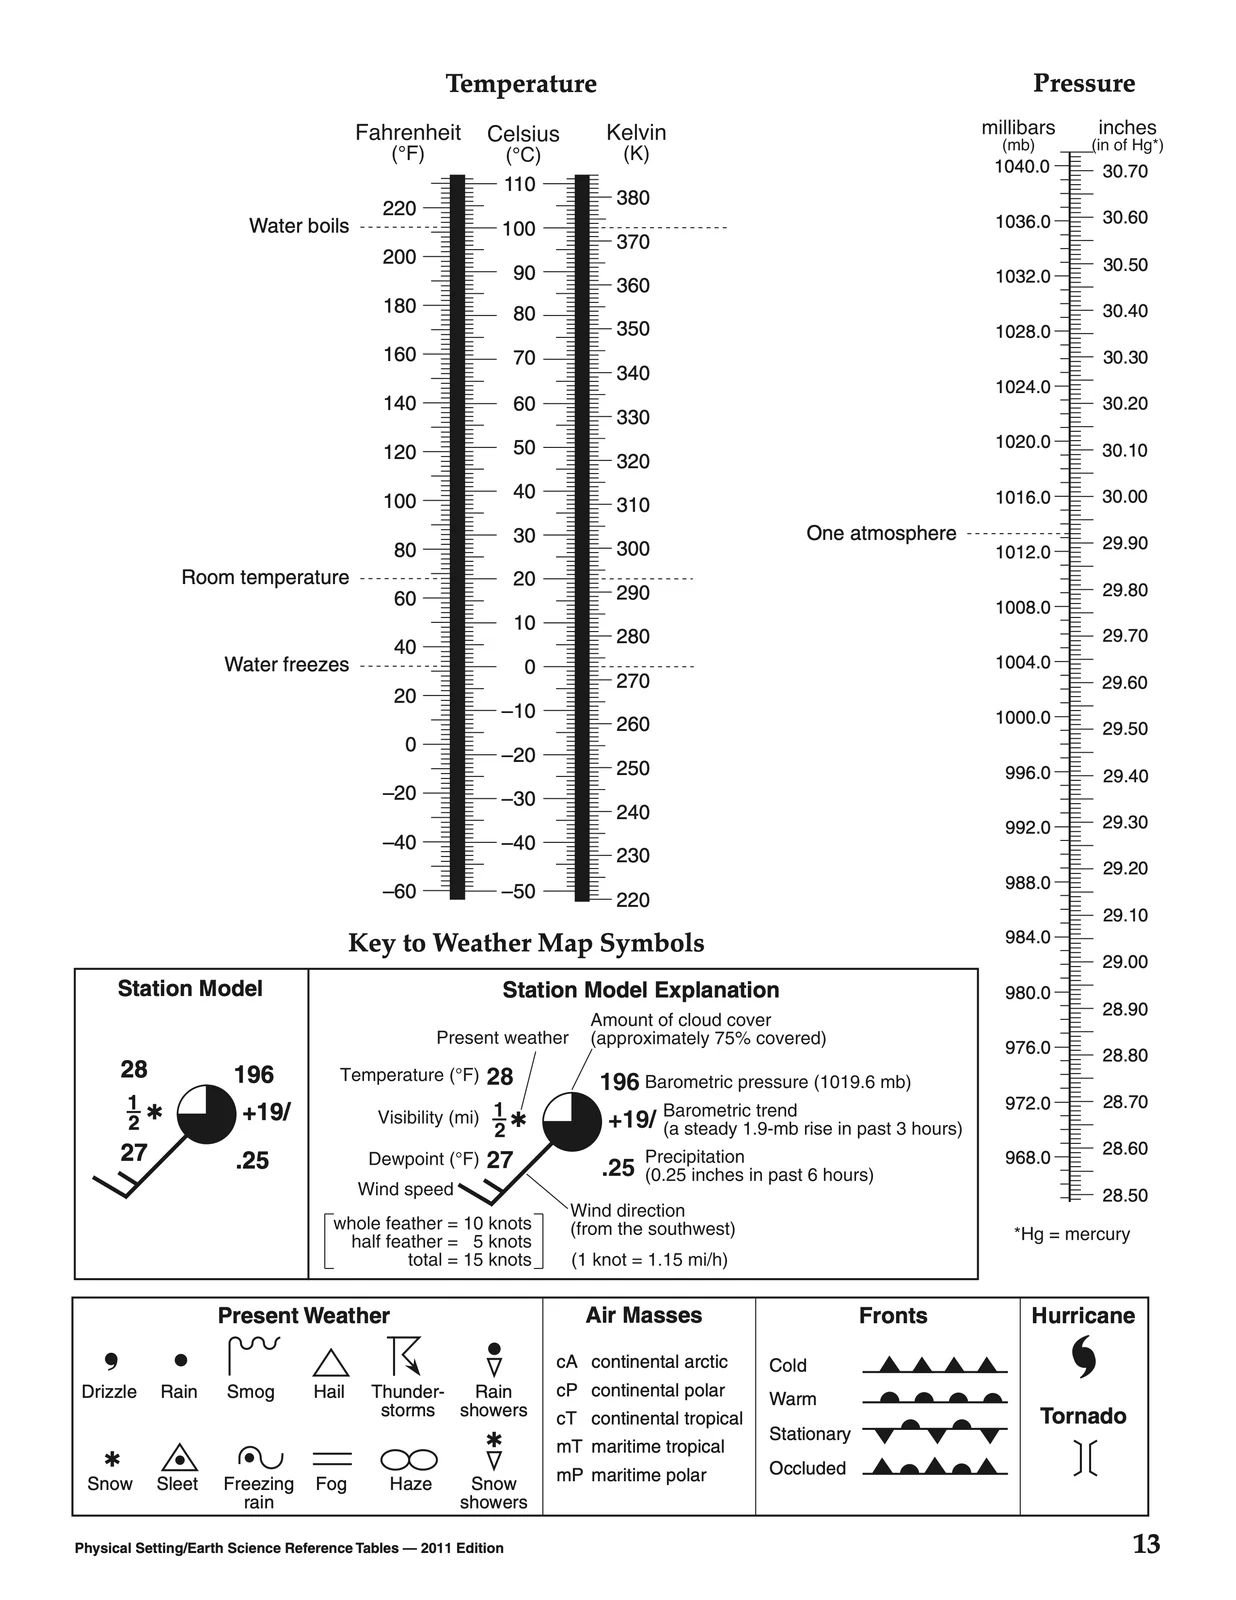
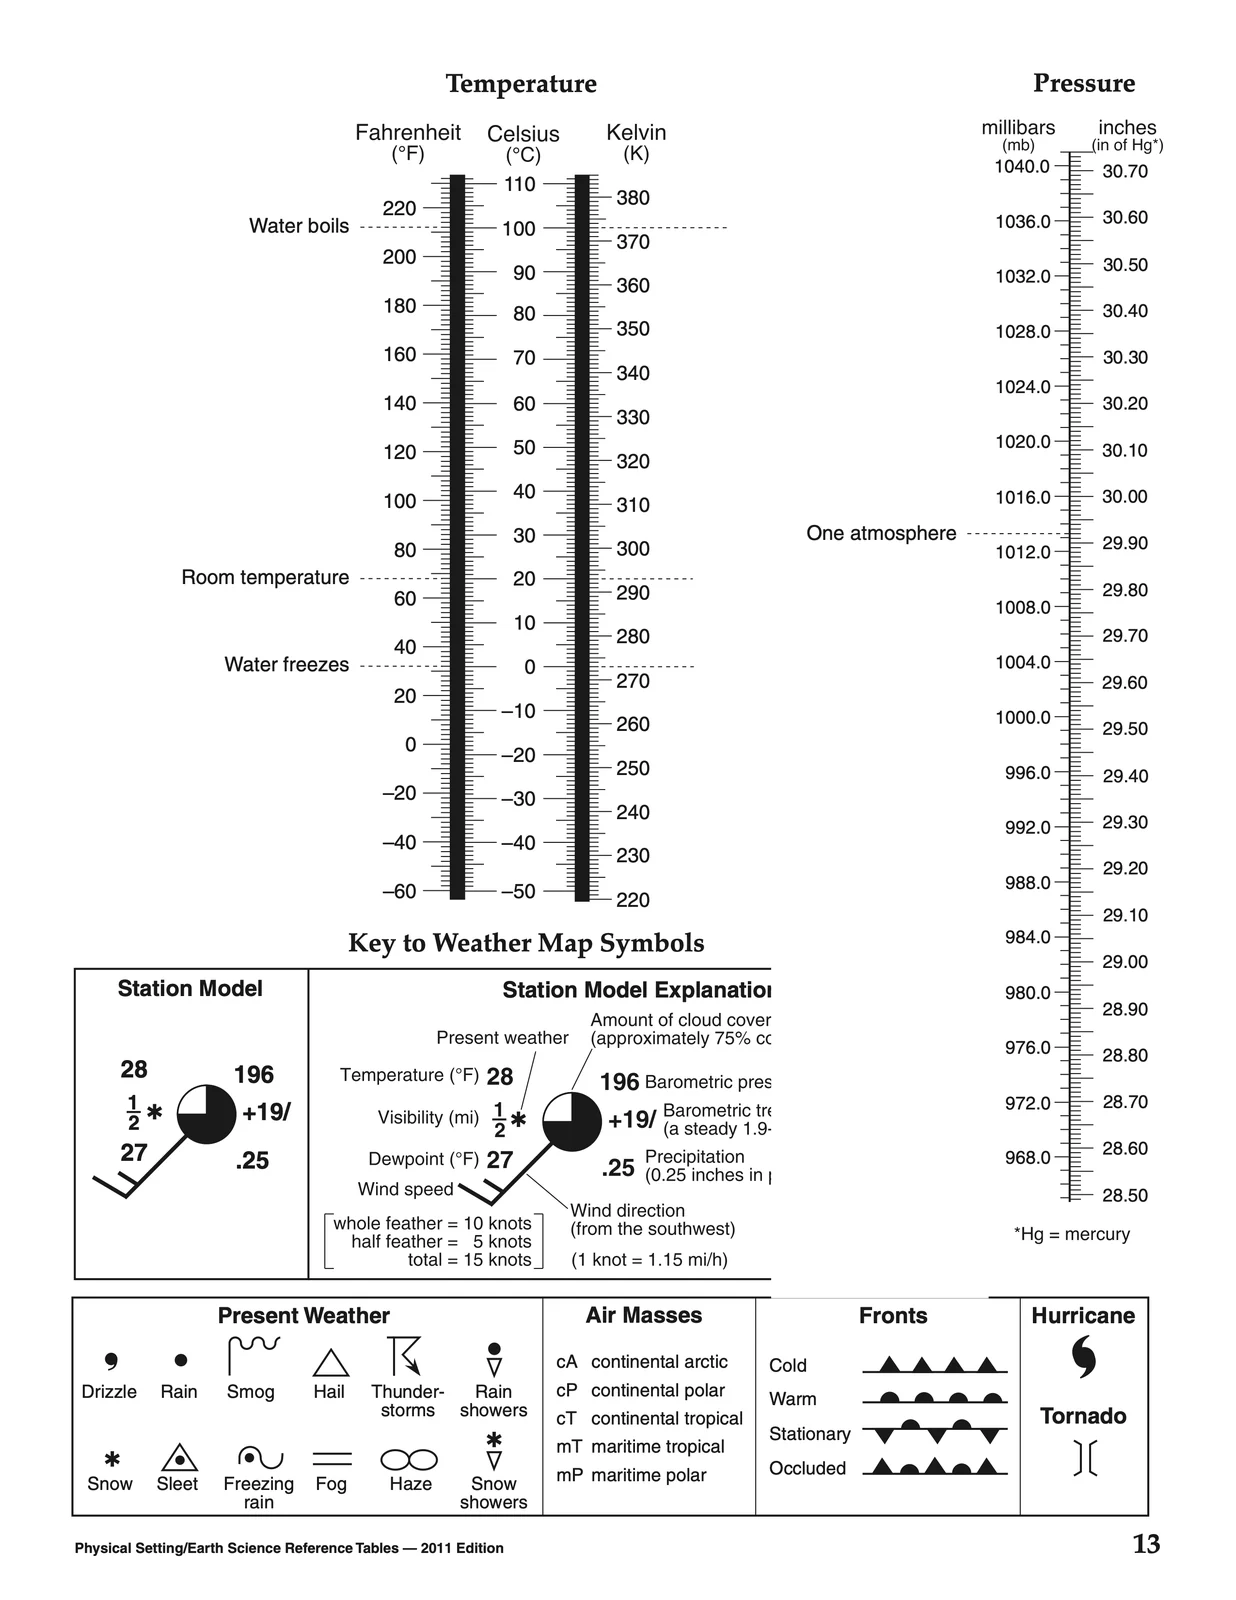
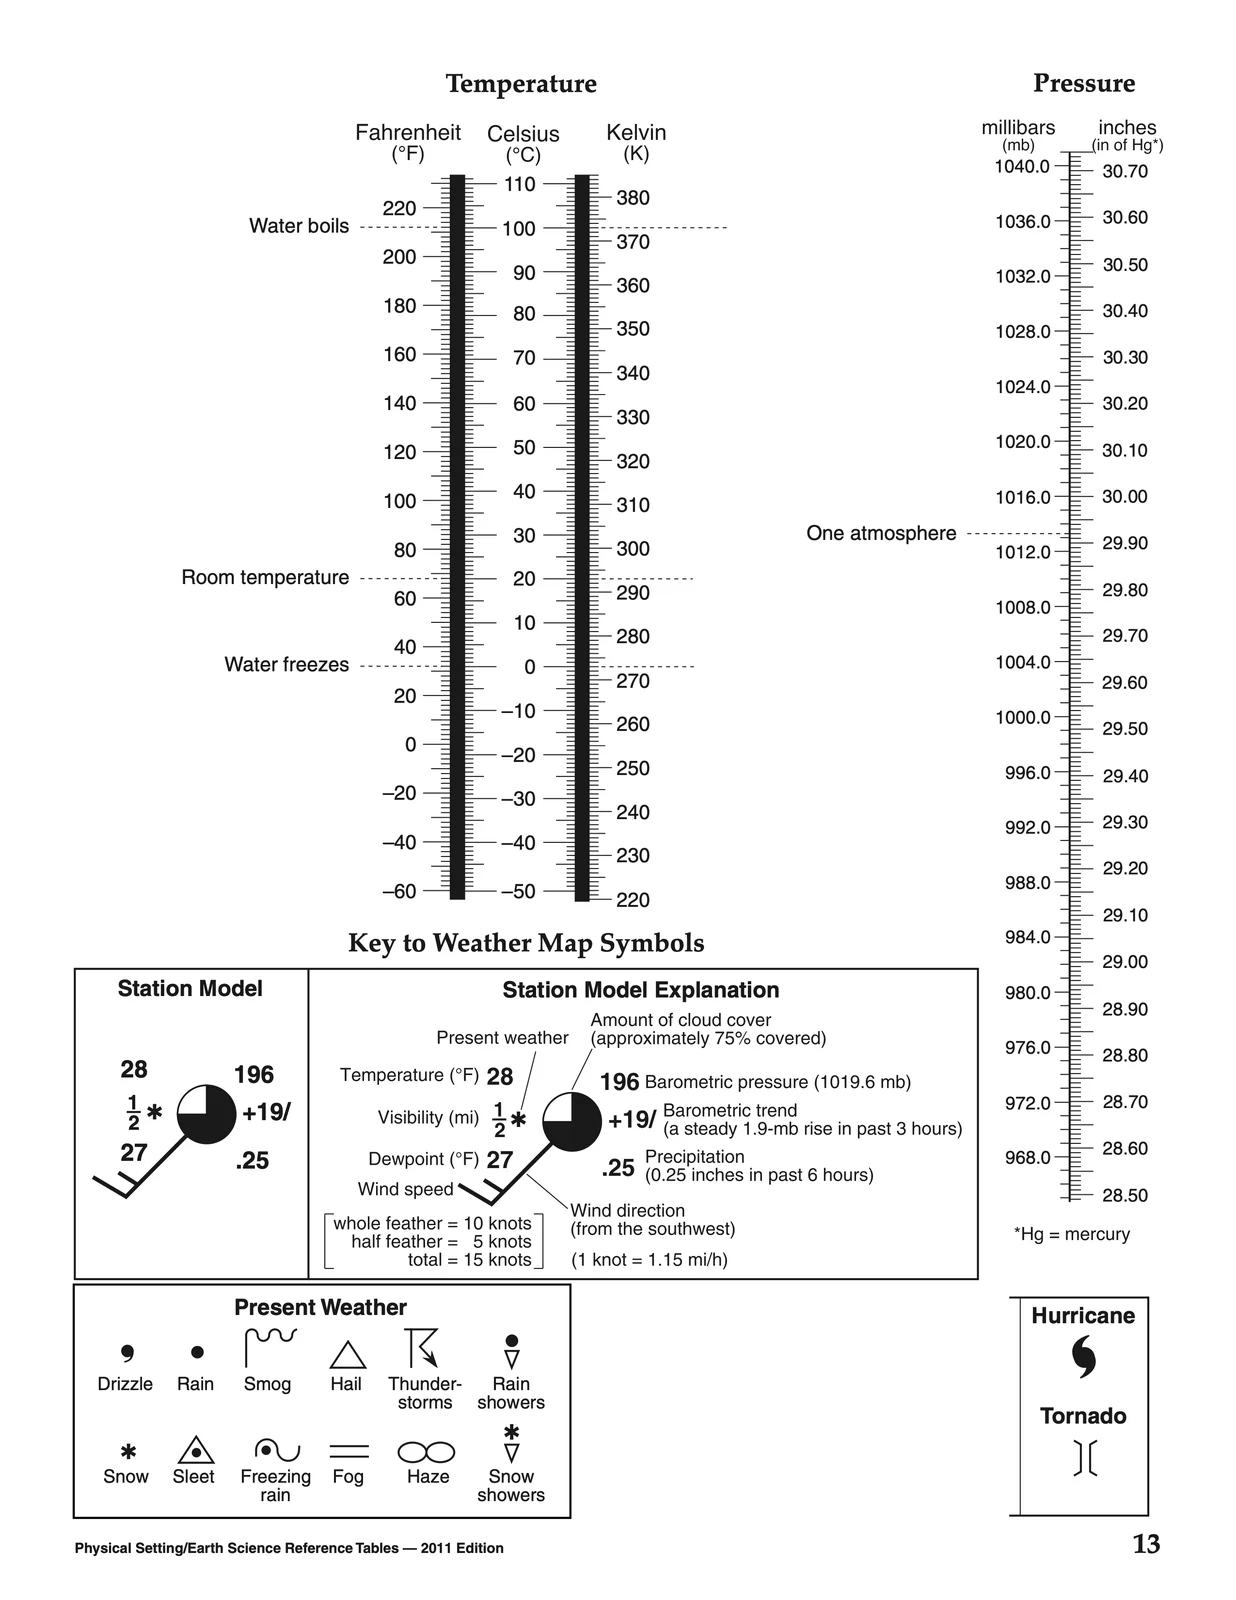
 Key to Weather Map Symbols
 Life Cycles of Stars Model
 Locations of Selected Hotspots
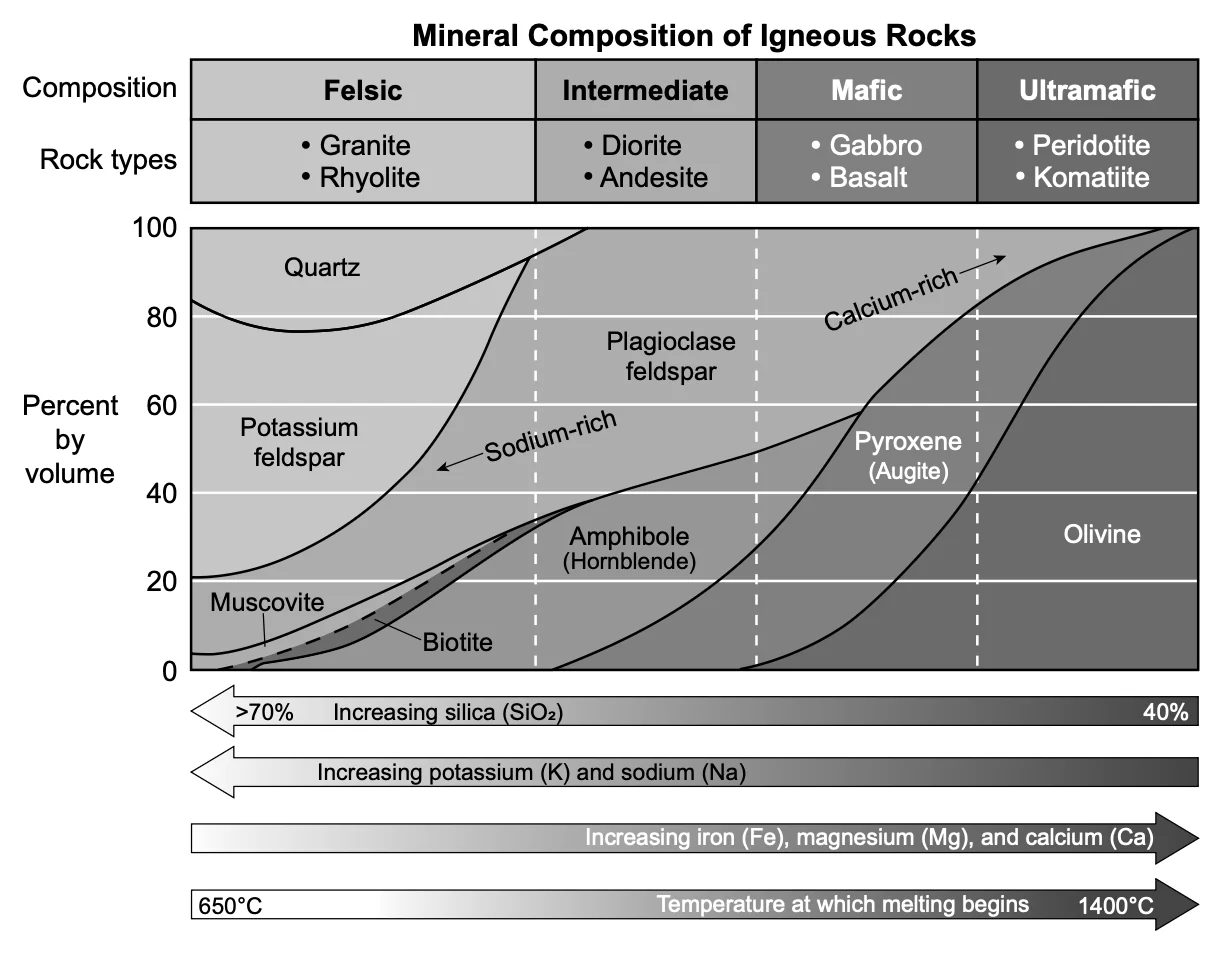
 Mineral Composition of Igneous Rocks
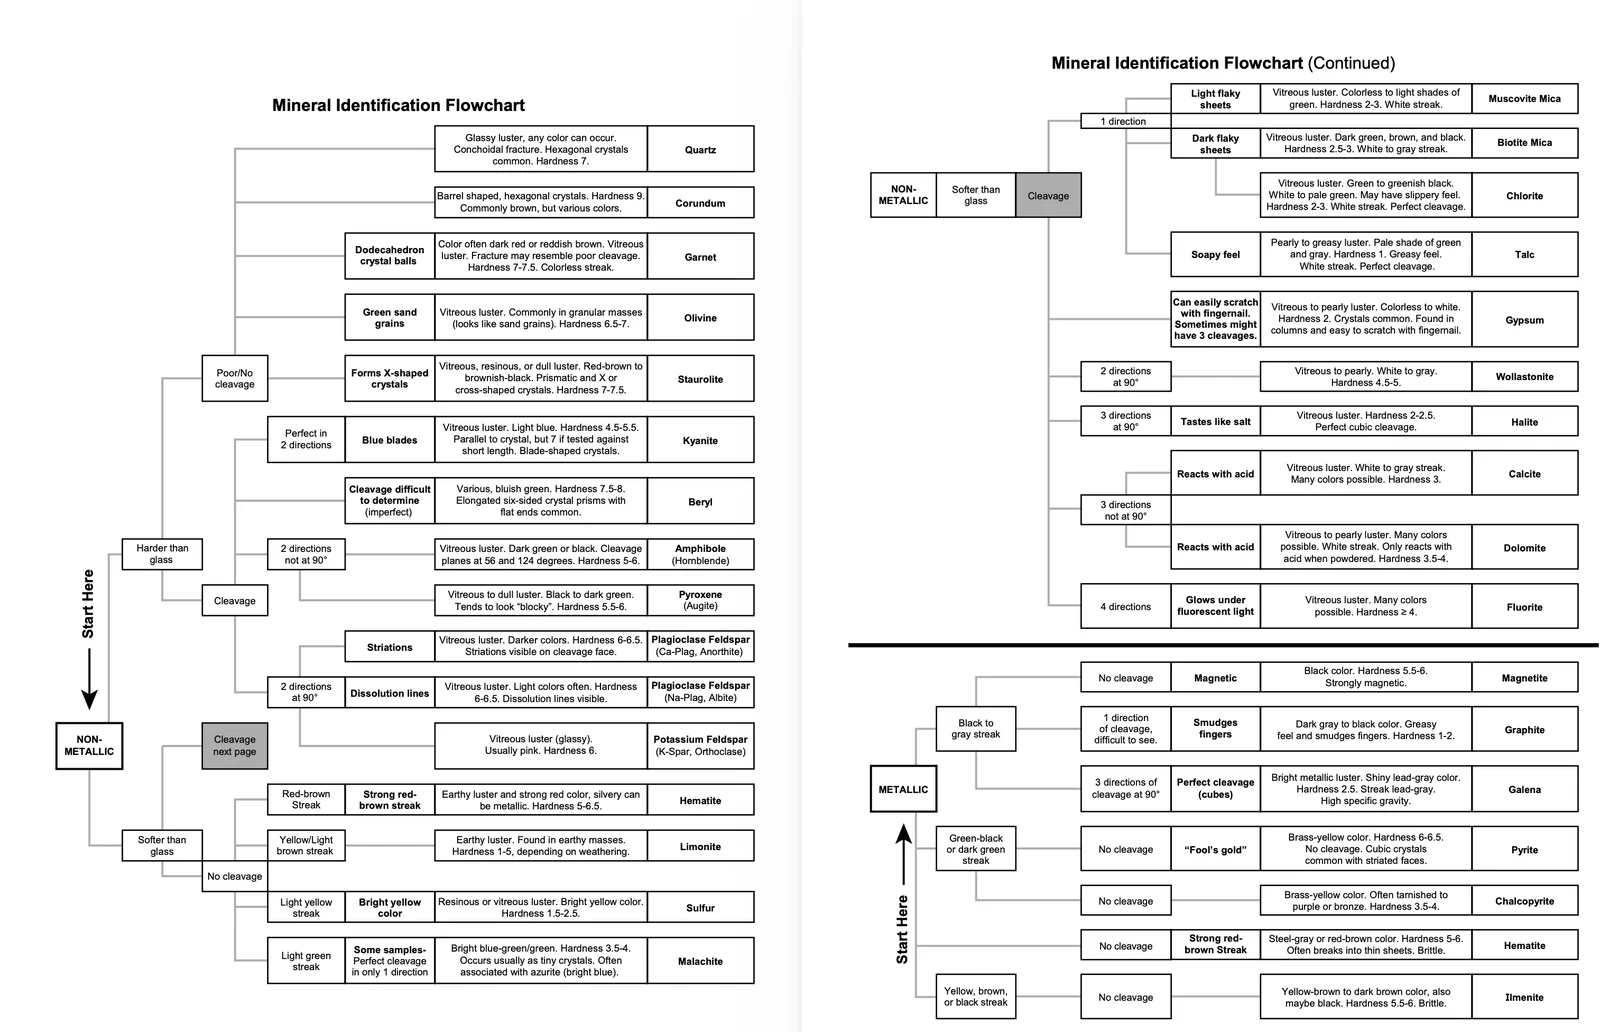
 Mineral Identification Flowchart
 Model of Bowen's Reaction Series
 Model of Generalized Planetary Wind Belts
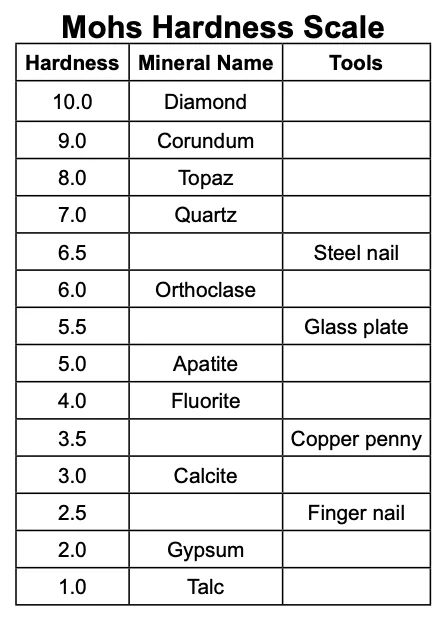
 Mohs Hardness Scale
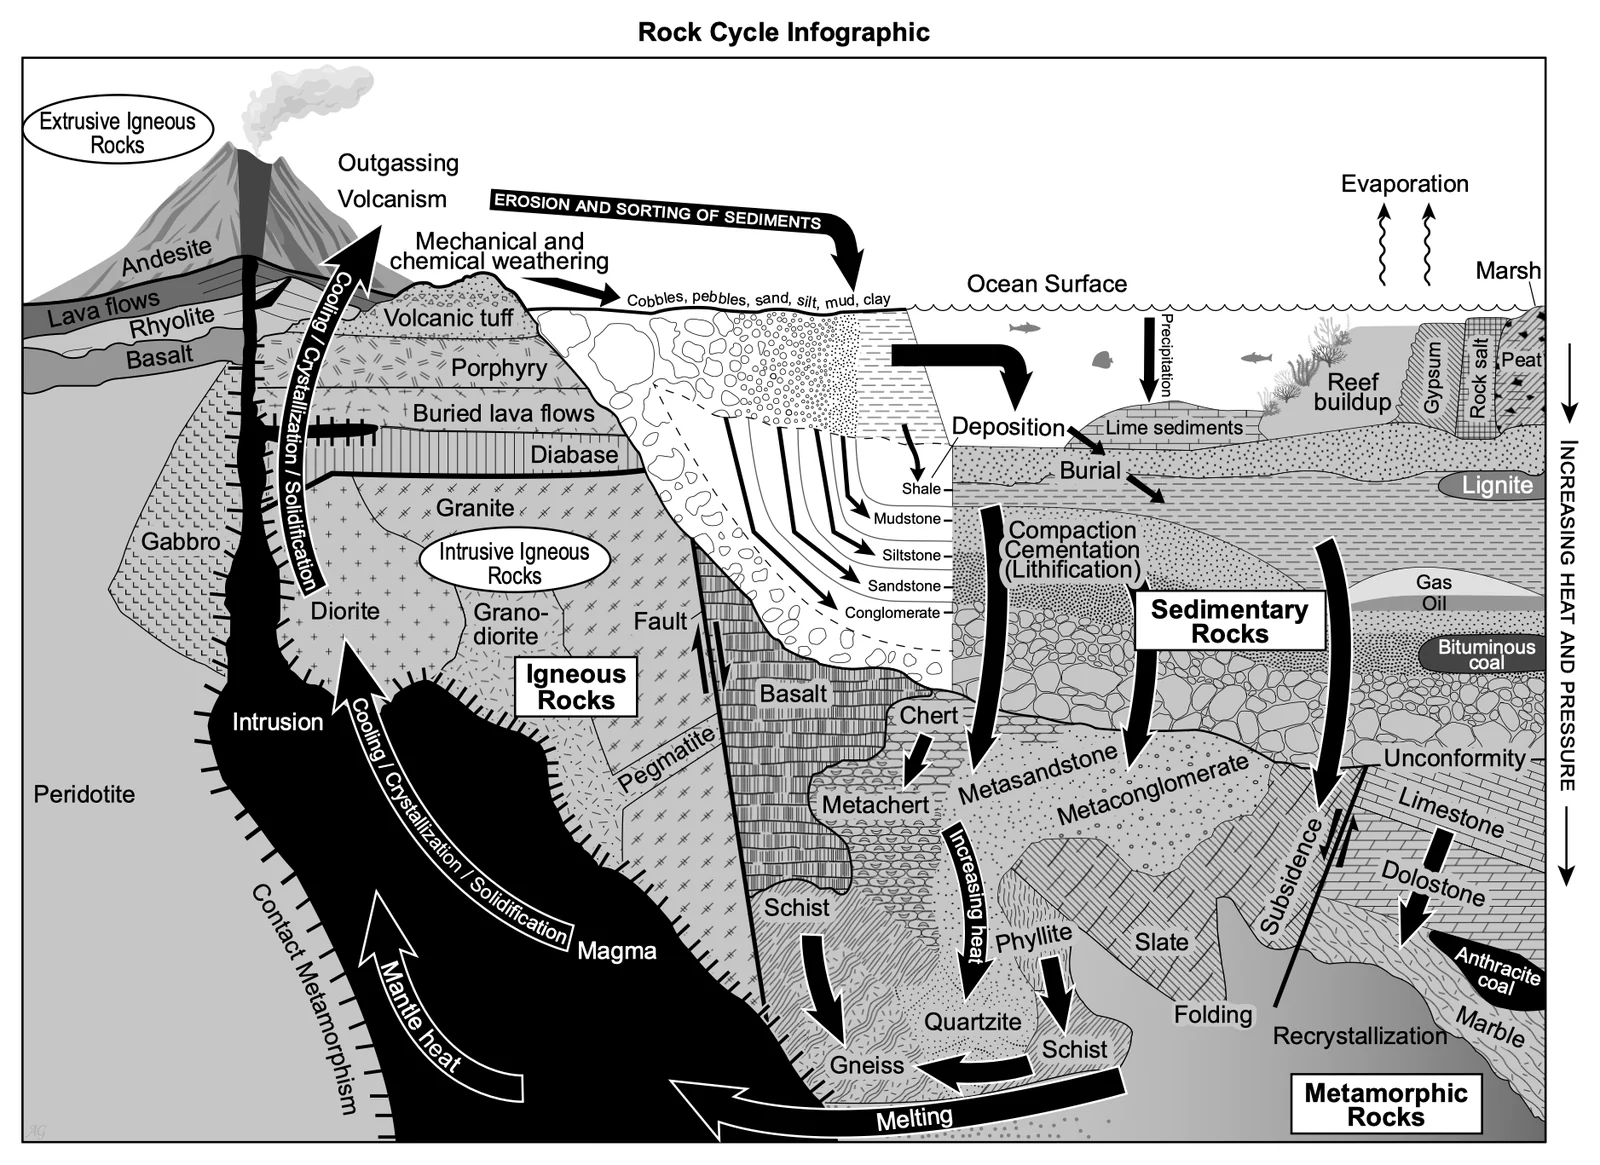
 Rock Cycle Infographic
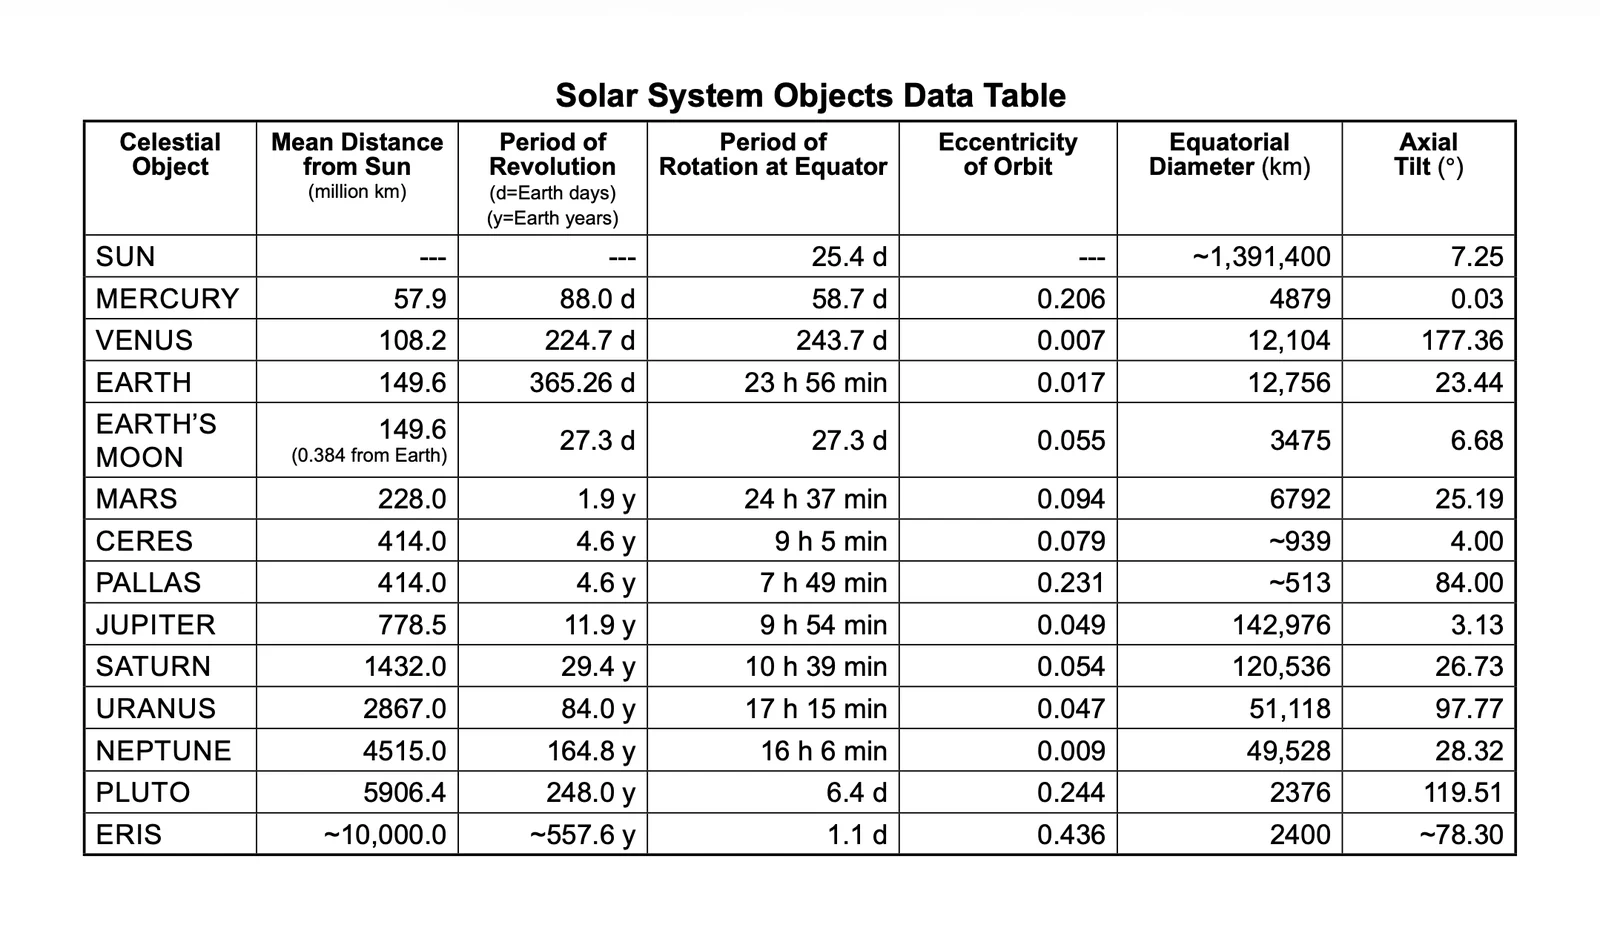
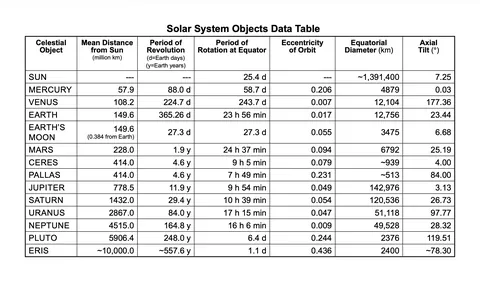 Solar System Objects Data Table
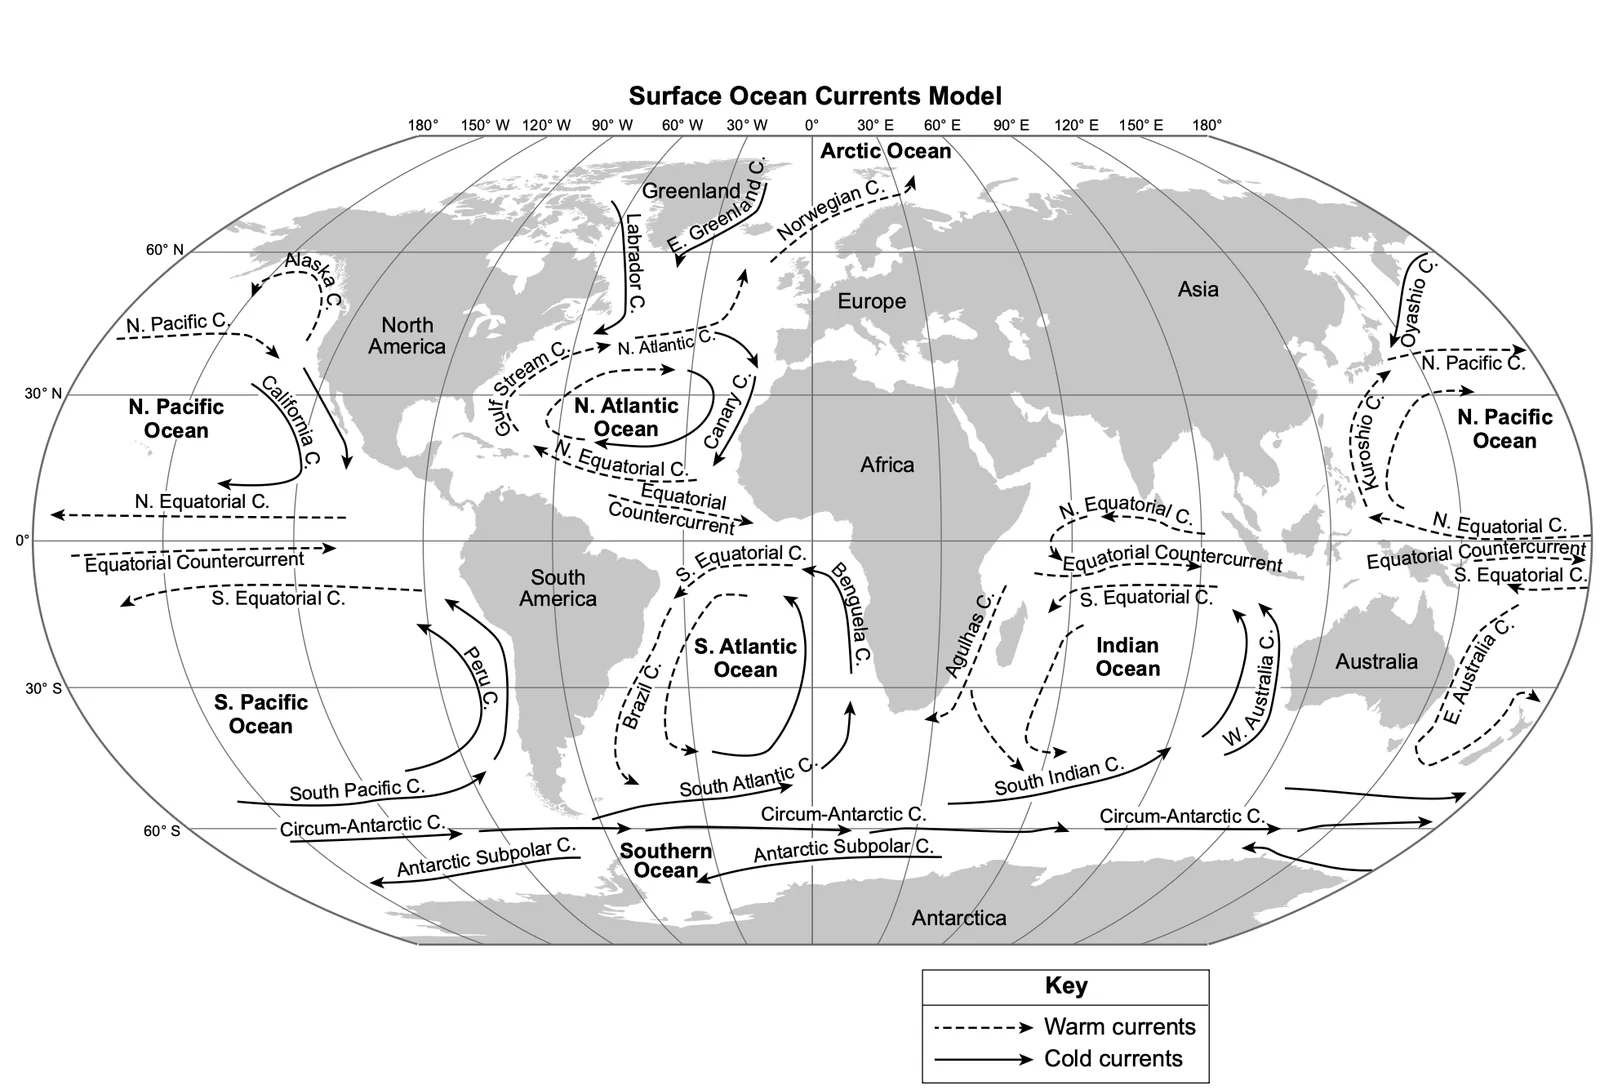
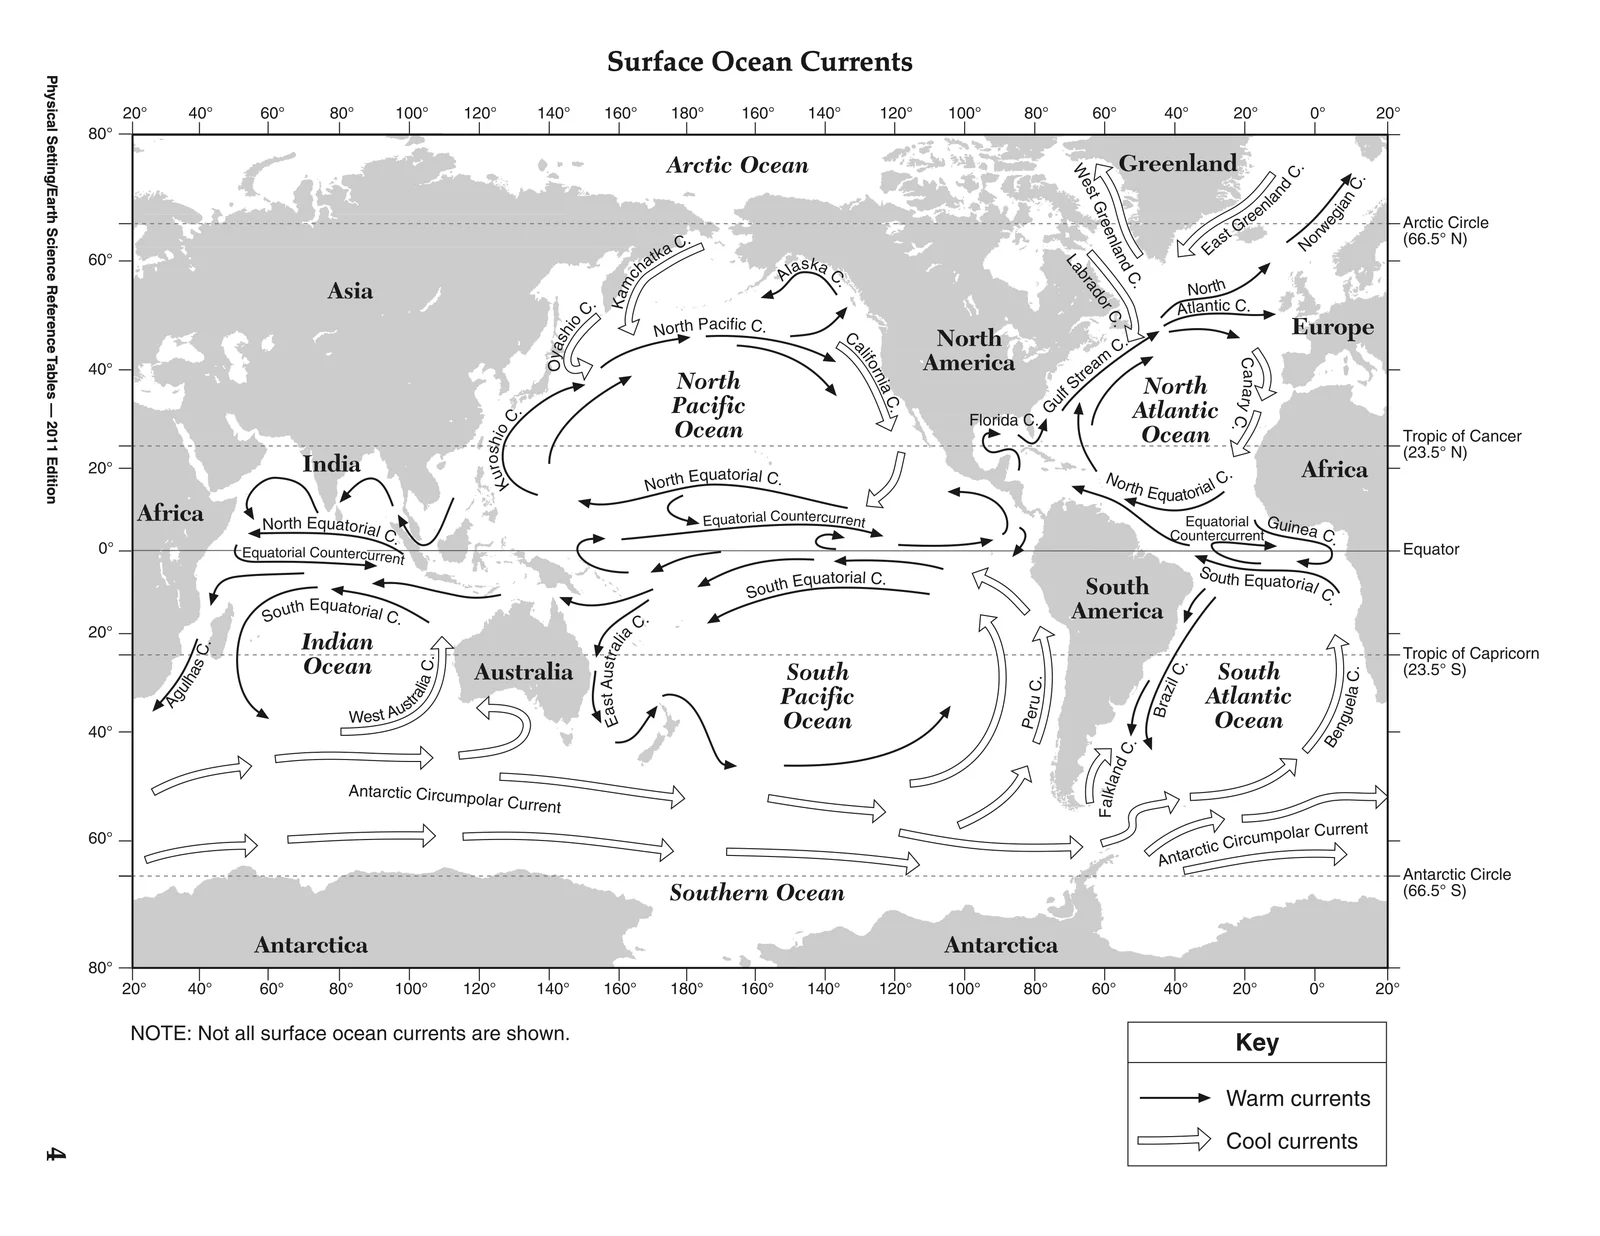
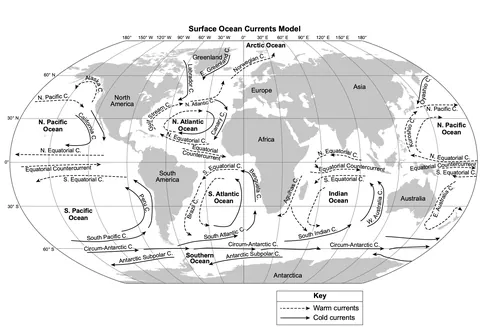 Surface Ocean Currents Model
 Air Masses
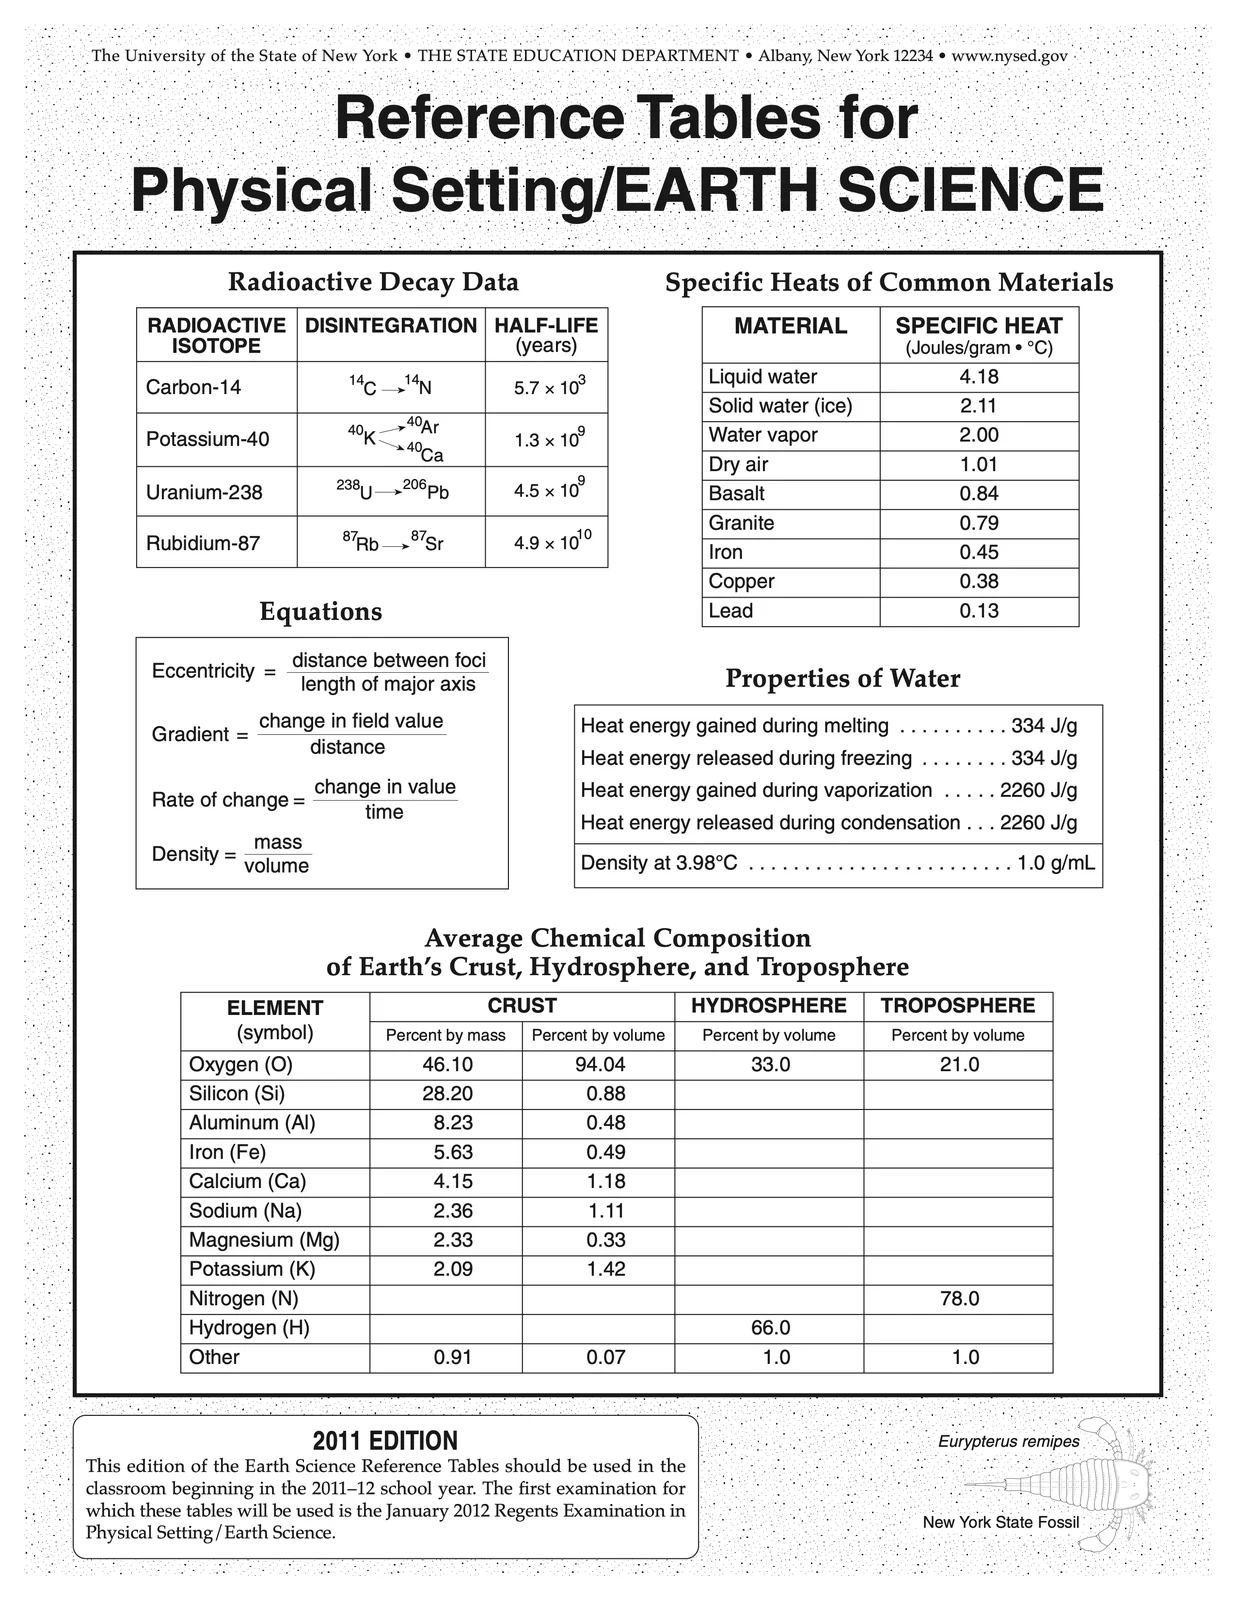
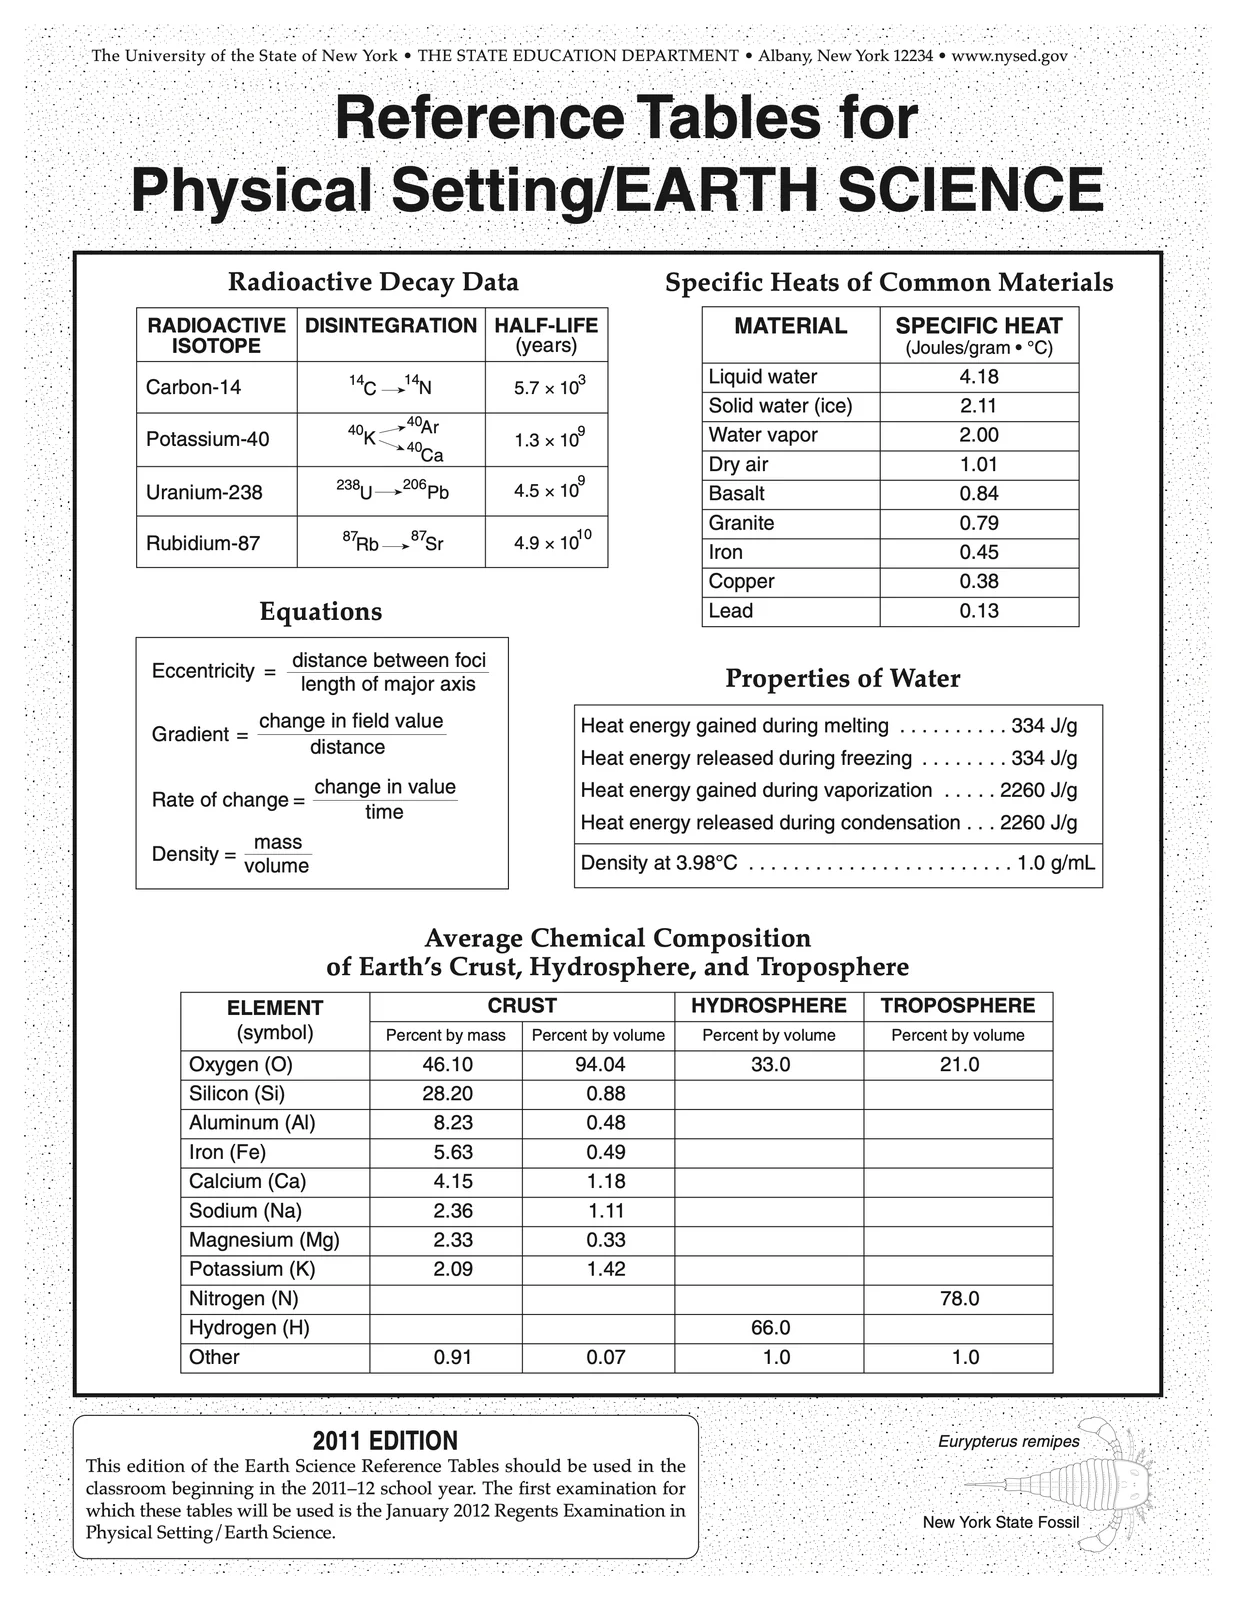
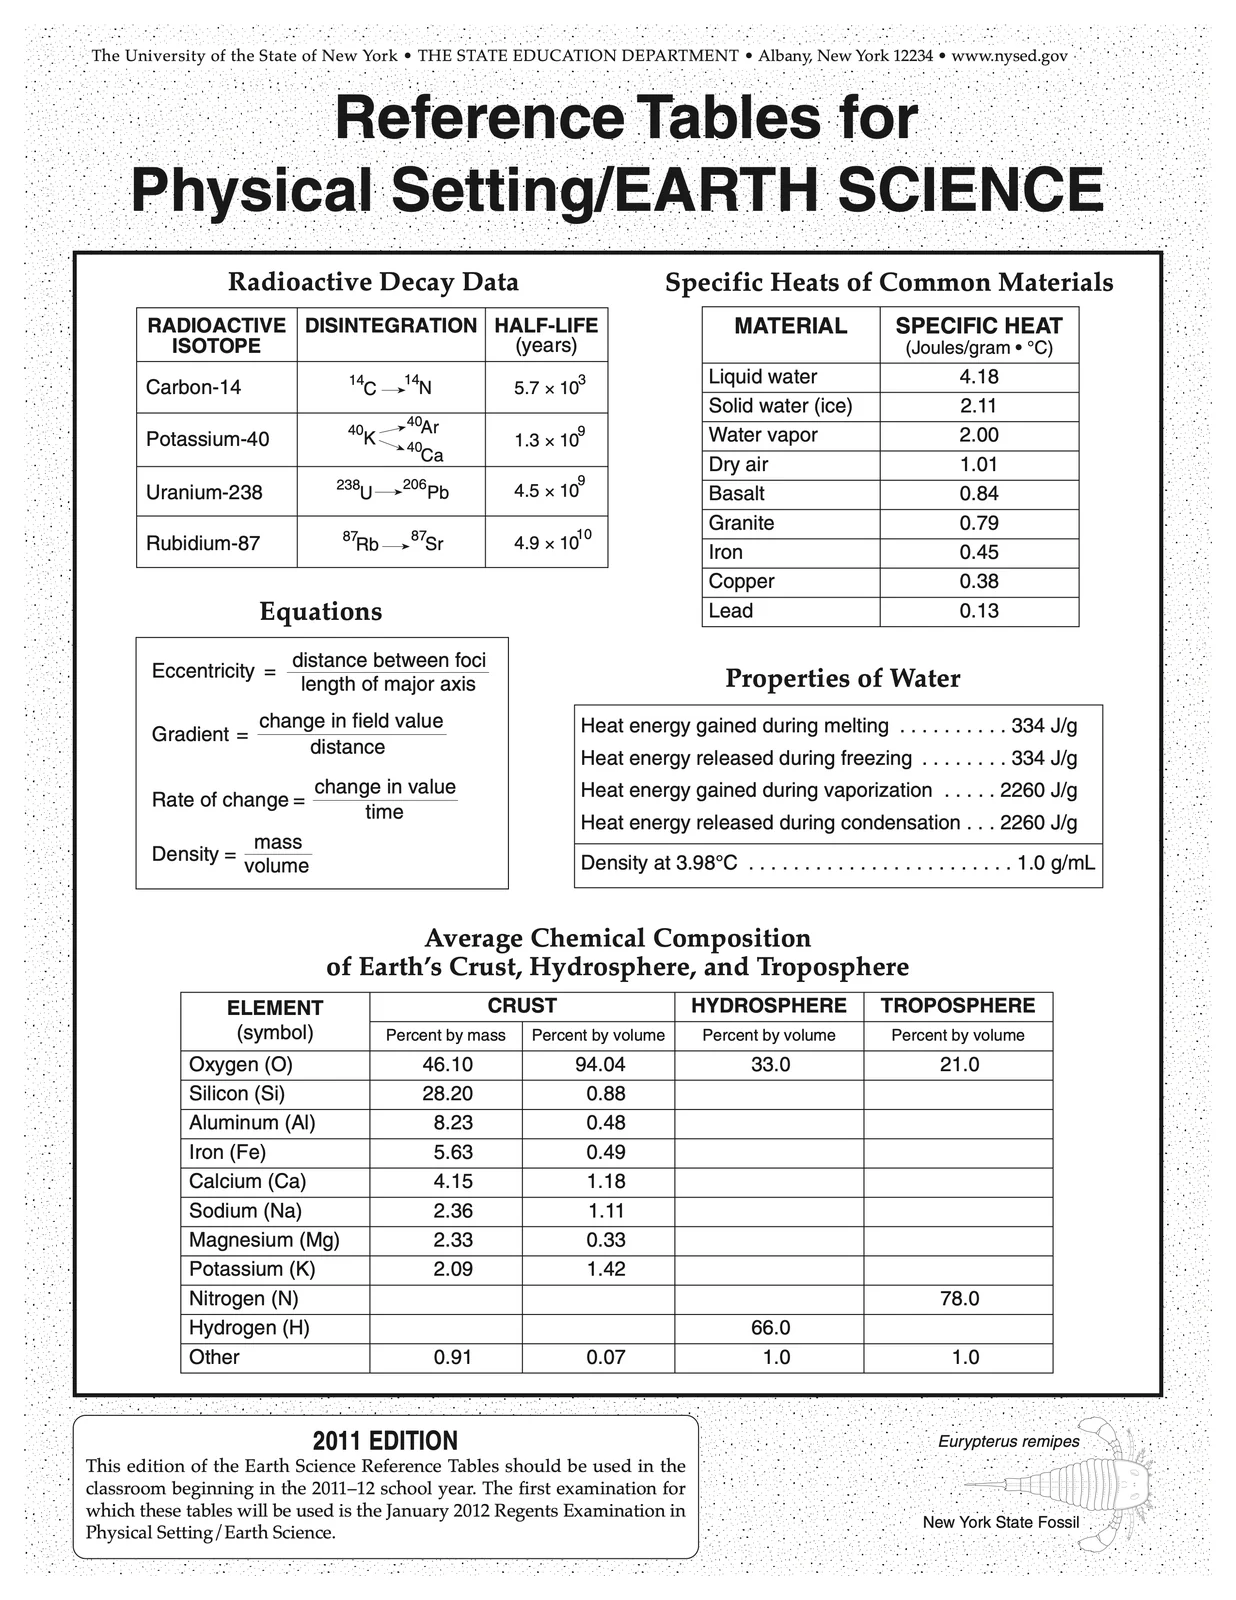
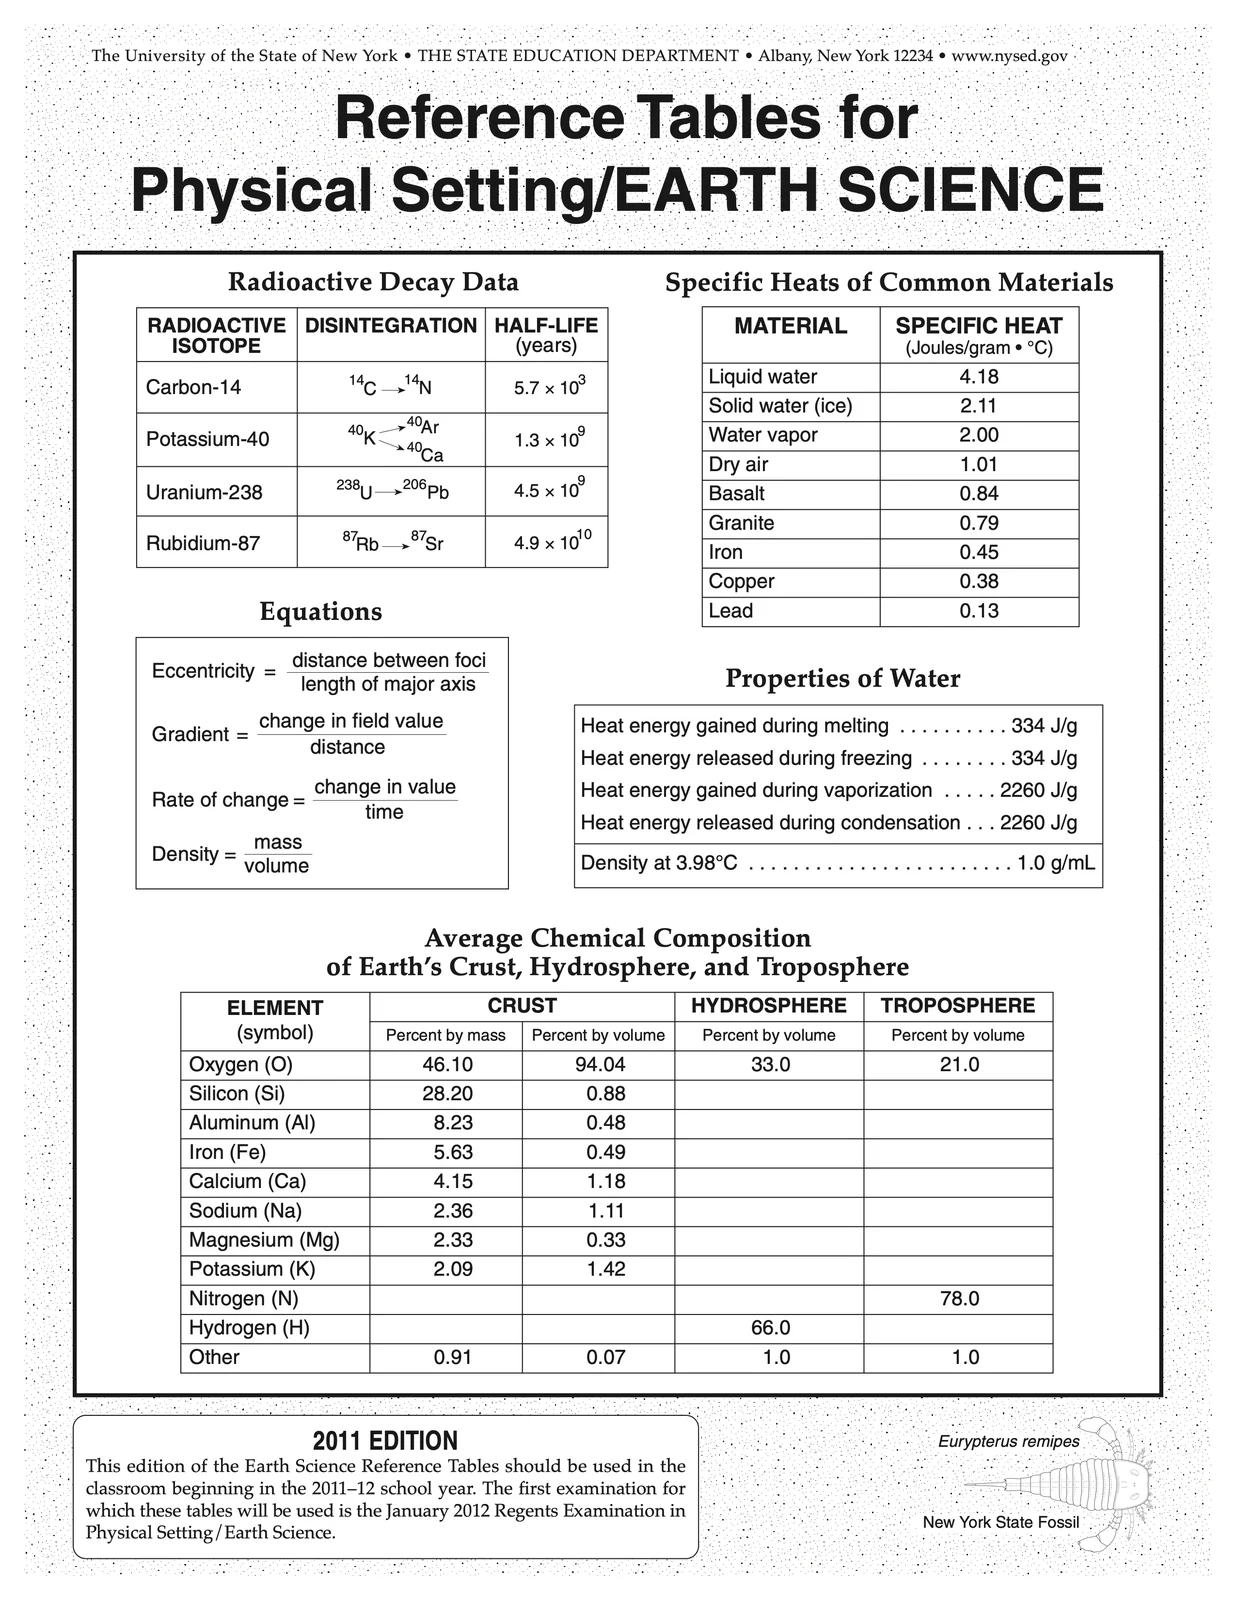
 Average Chemical Composition of Earth's Crust, Hydrosphere, and Troposphere
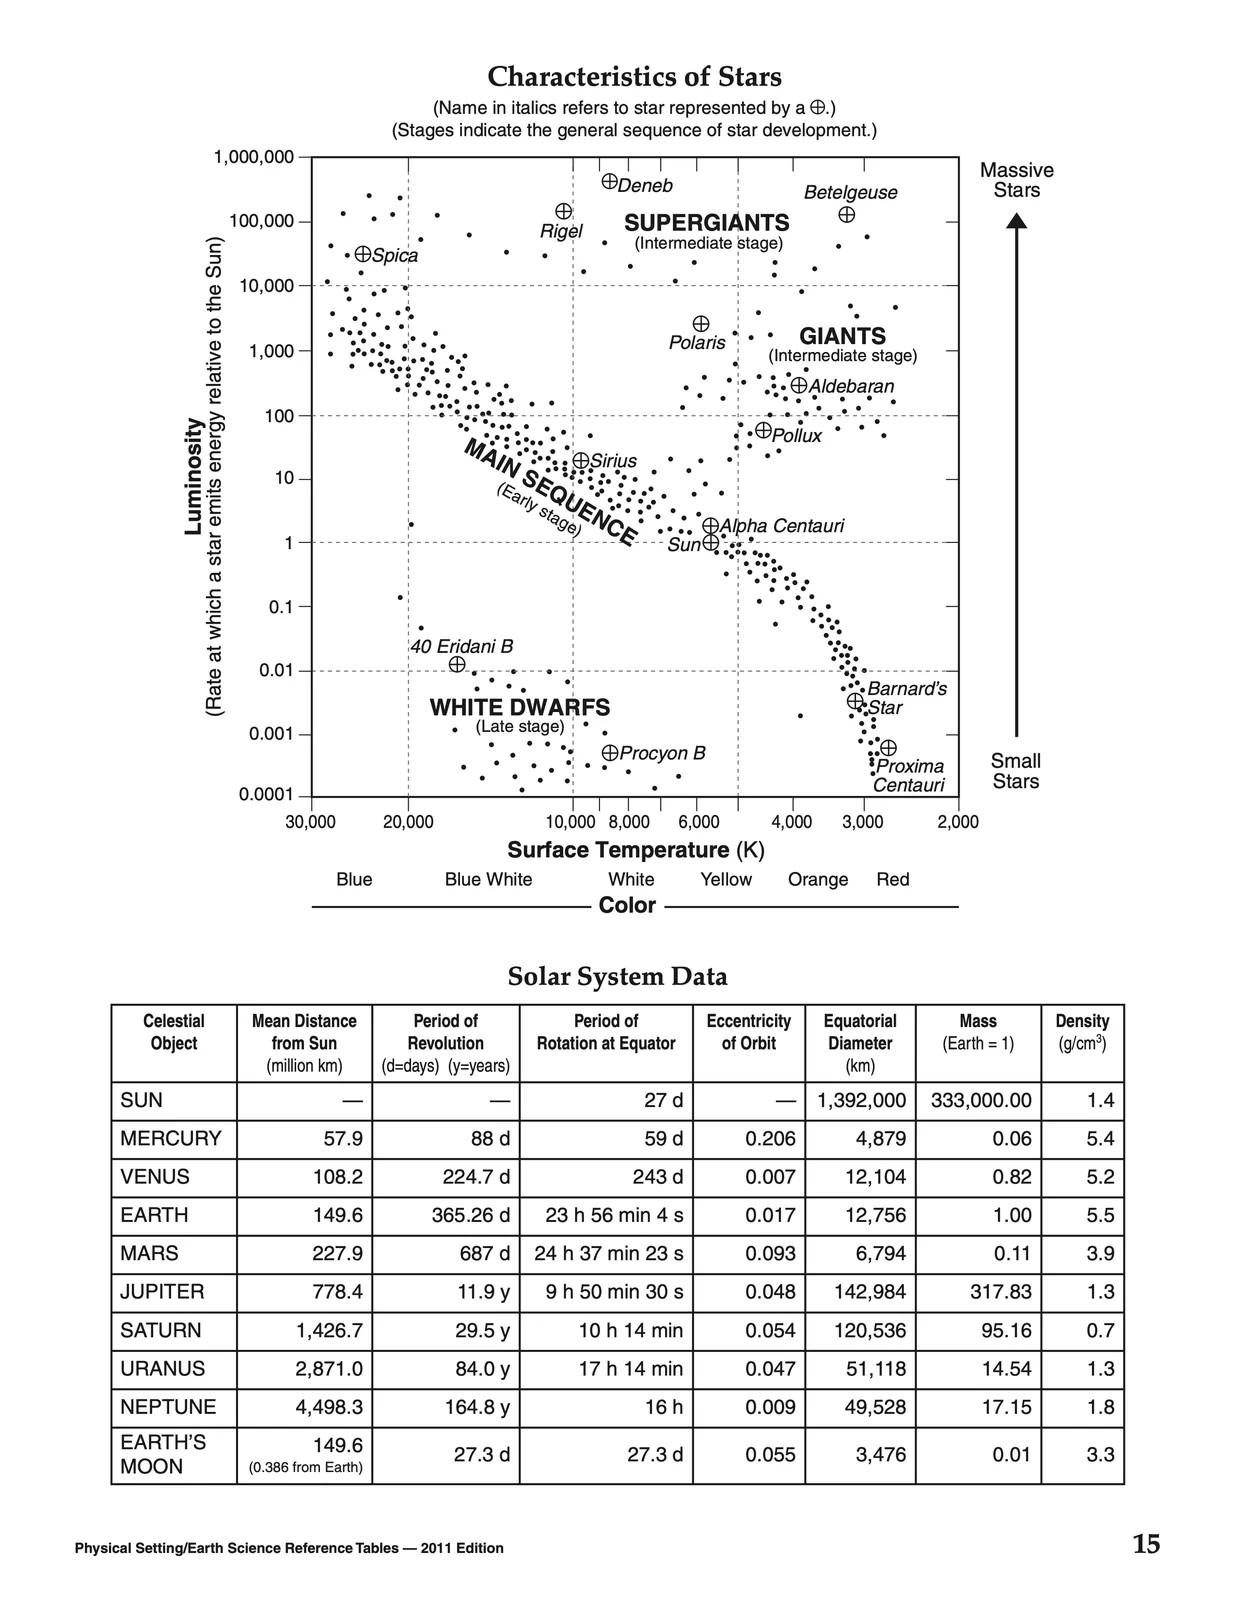
 Characteristics of Stars
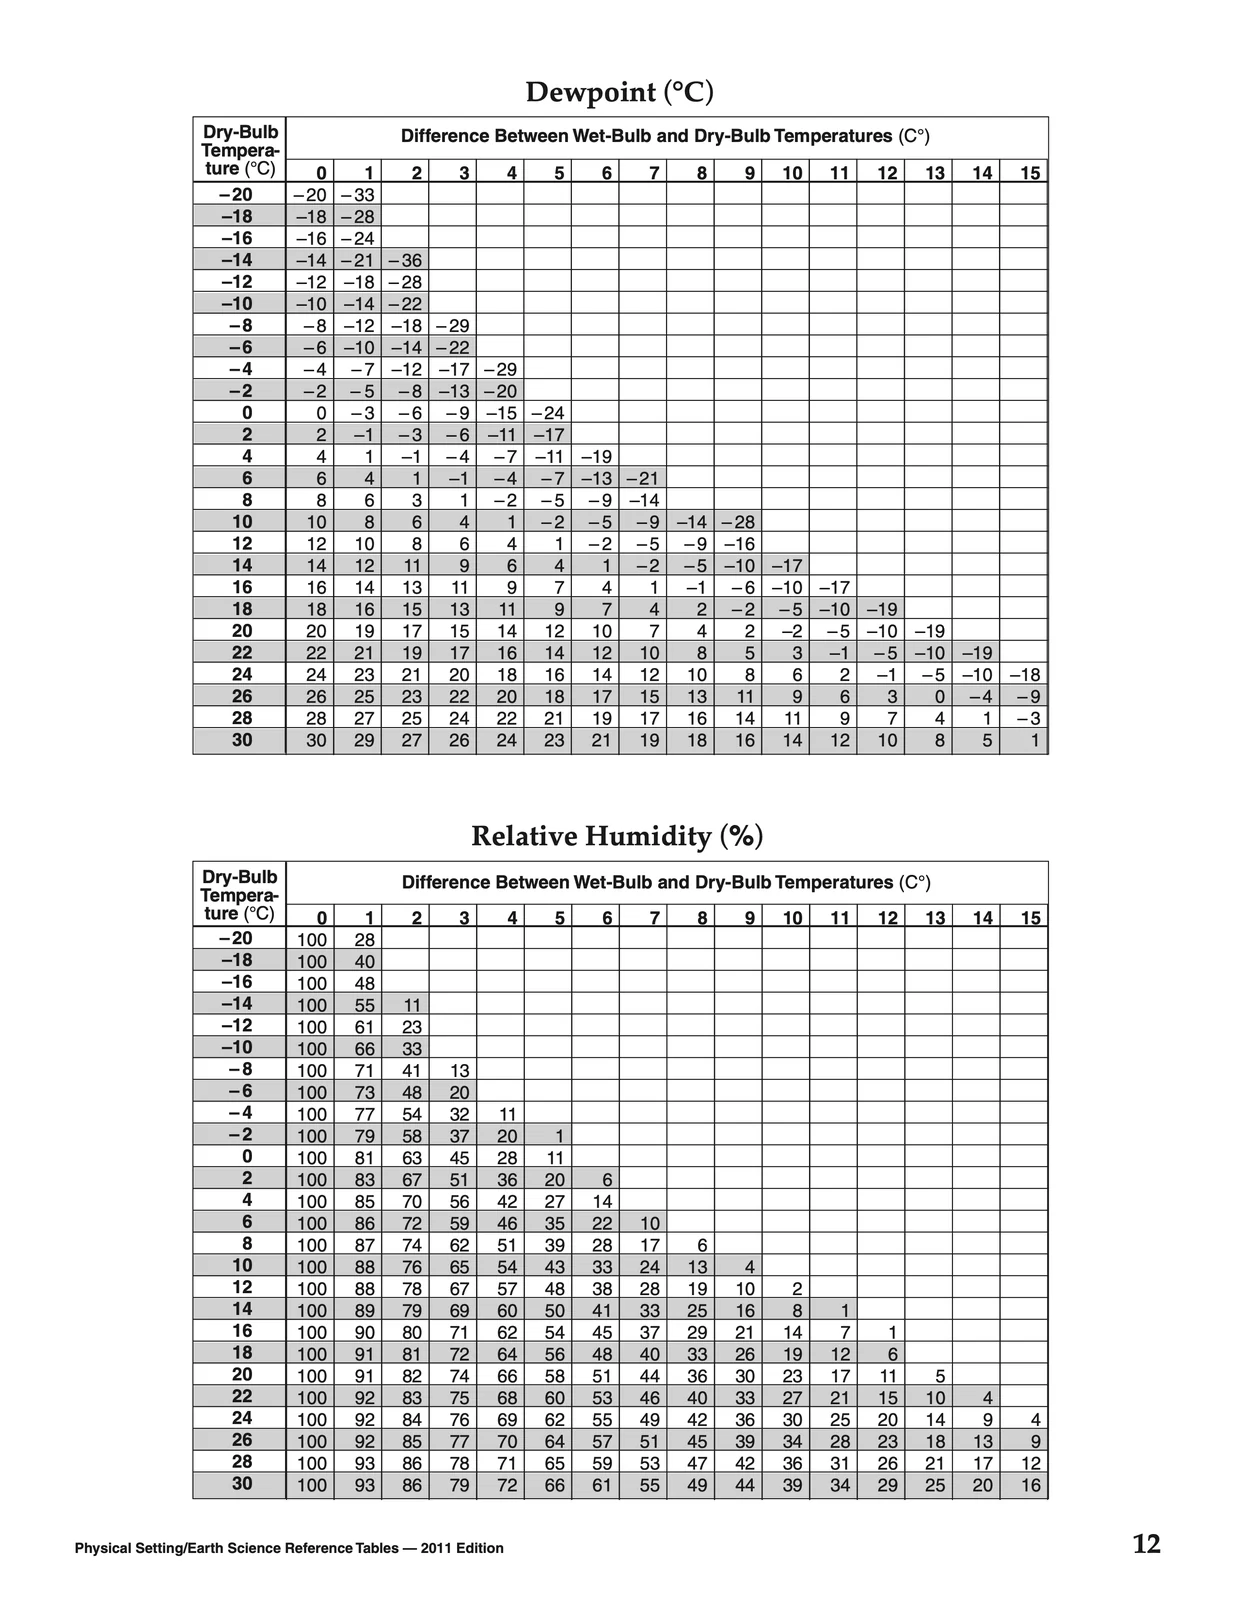
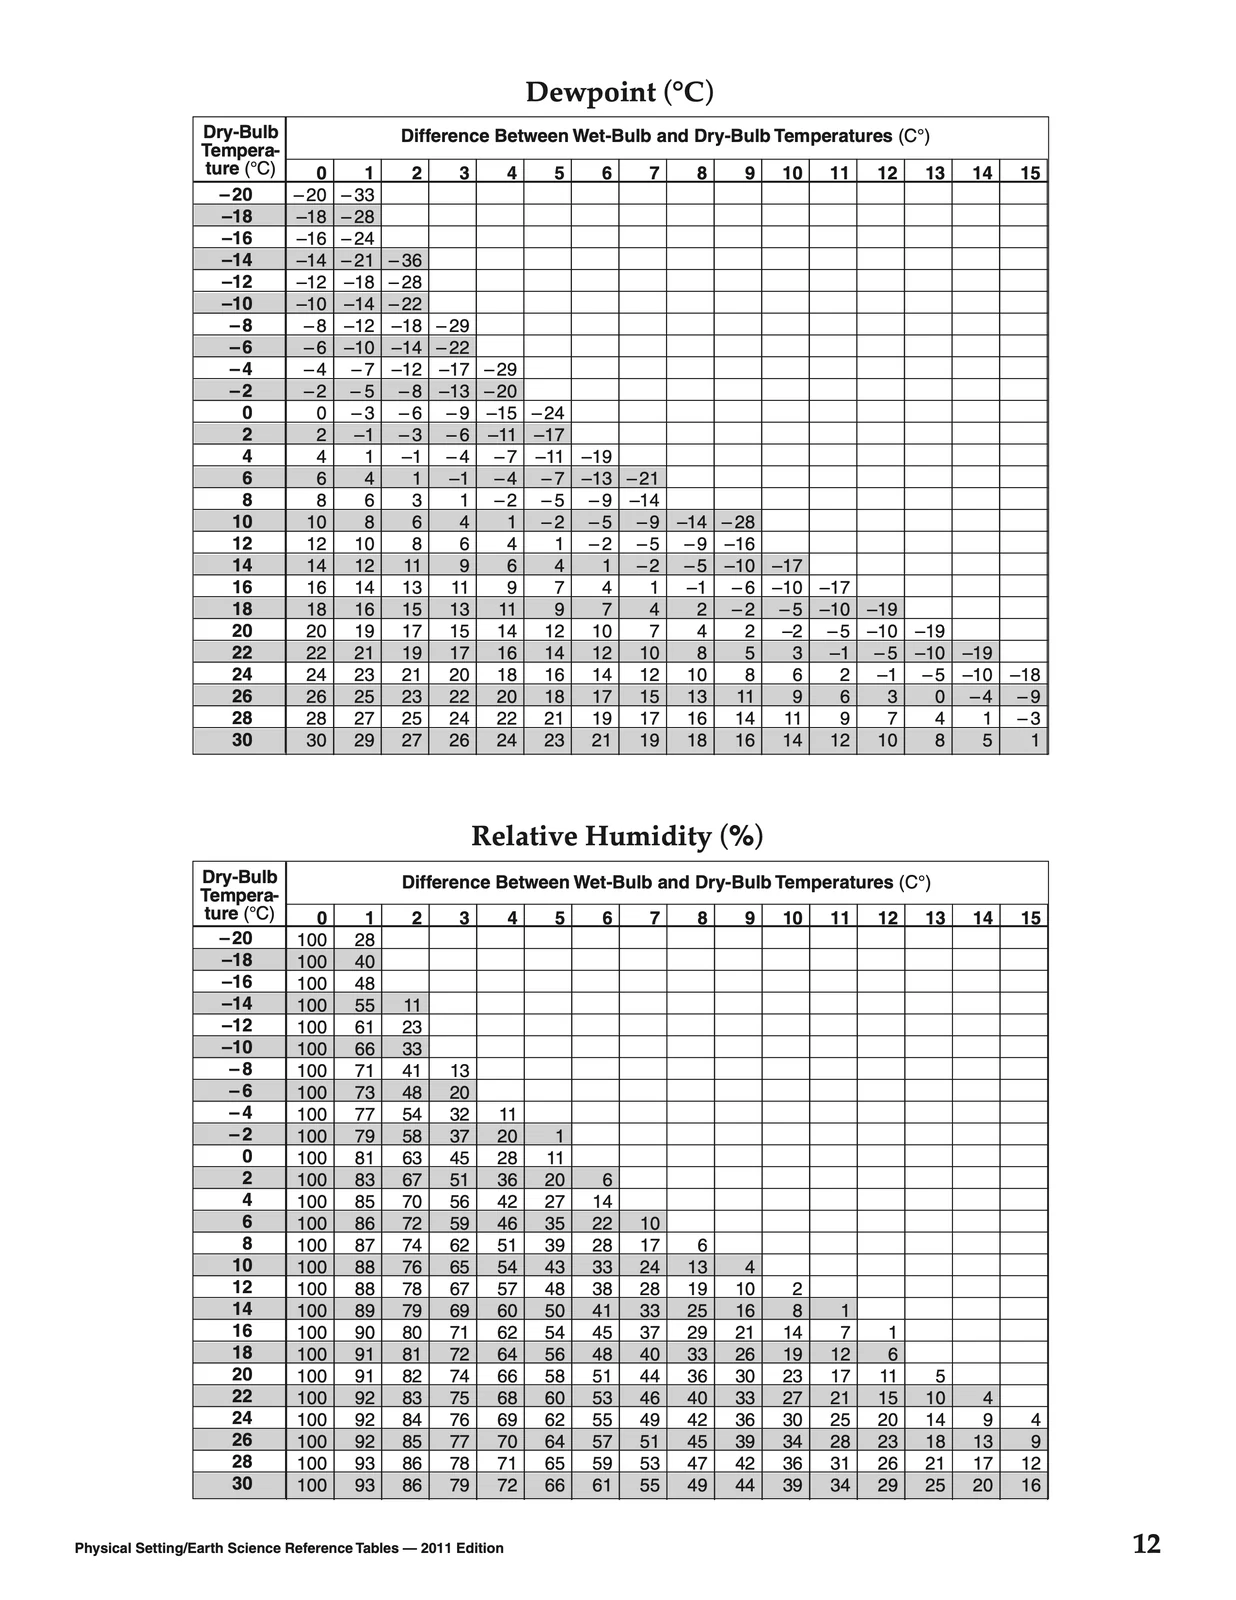
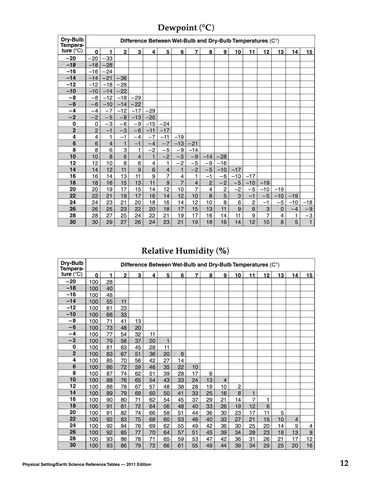 Dewpoint
 Earthquake P-Wave and S-Wave Travel Time
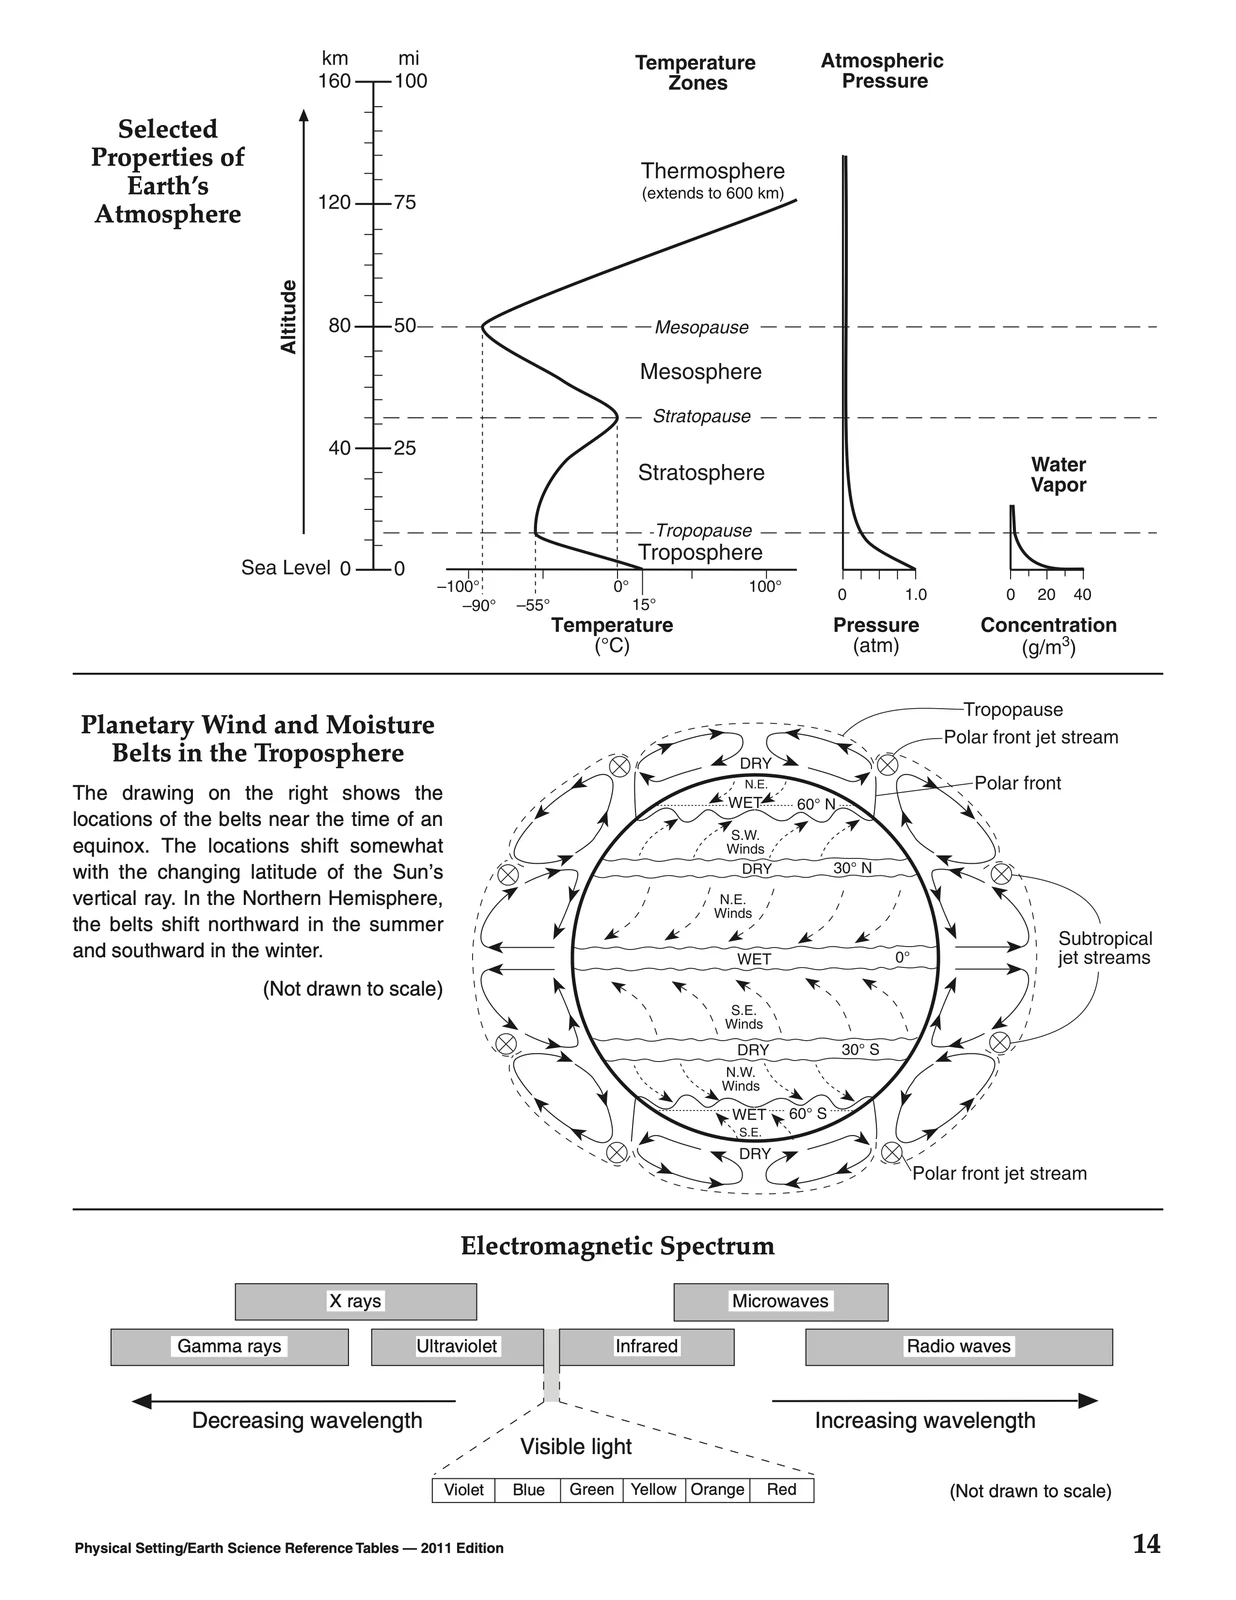
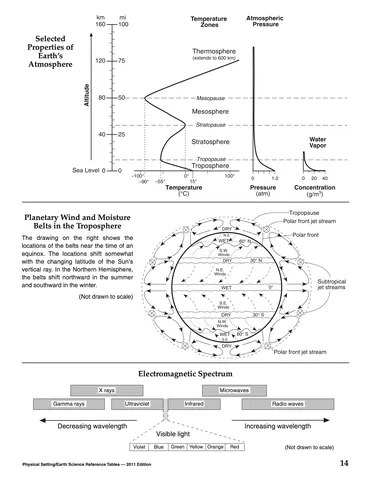 Electromagnetic Spectrum
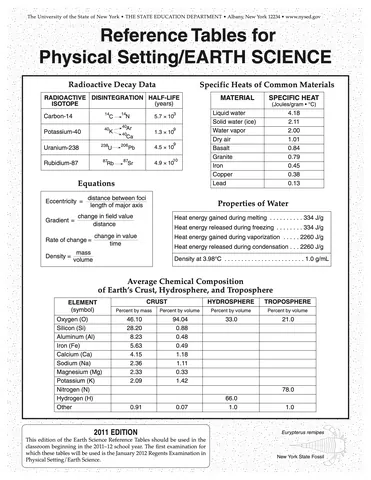 Equations
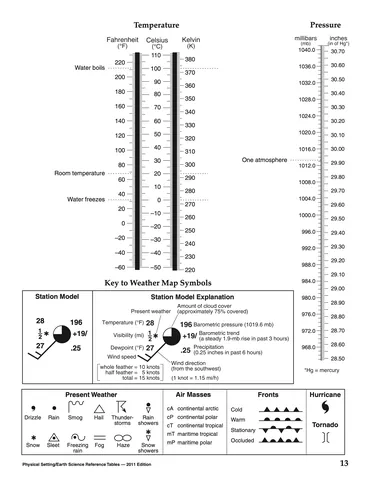 Fronts
 Generalized Landscape Regions of New York State
 Geologic History of New York State (Complete)
 Geologic History of New York State (Page 8)
 Geologic History of New York State (Page 9)
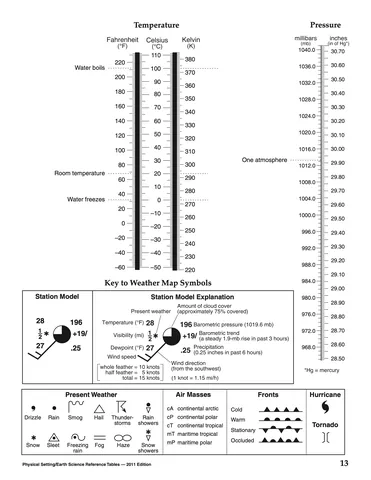 Hurricane and Tornado Symbols
 Inferred Properties of Earth's Interior
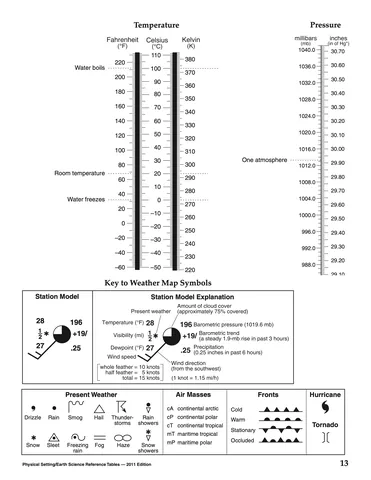 Key to Weather Map Symbols
 New York State Fossil
 Planetary Wind and Moisture Belts in the Troposphere
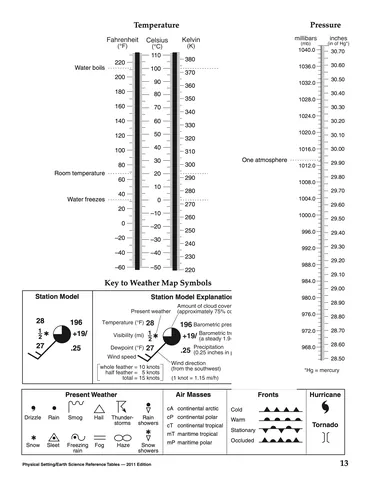 Pressure
 Properties of Common Minerals
 Properties of Water
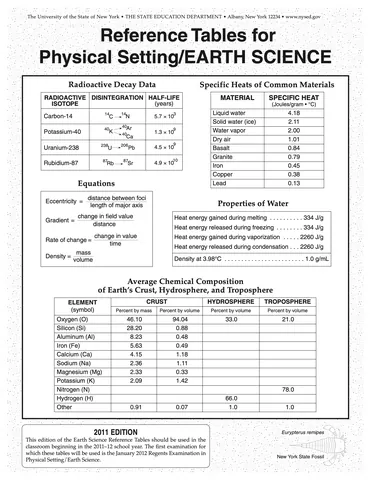 Radioactive Decay Data
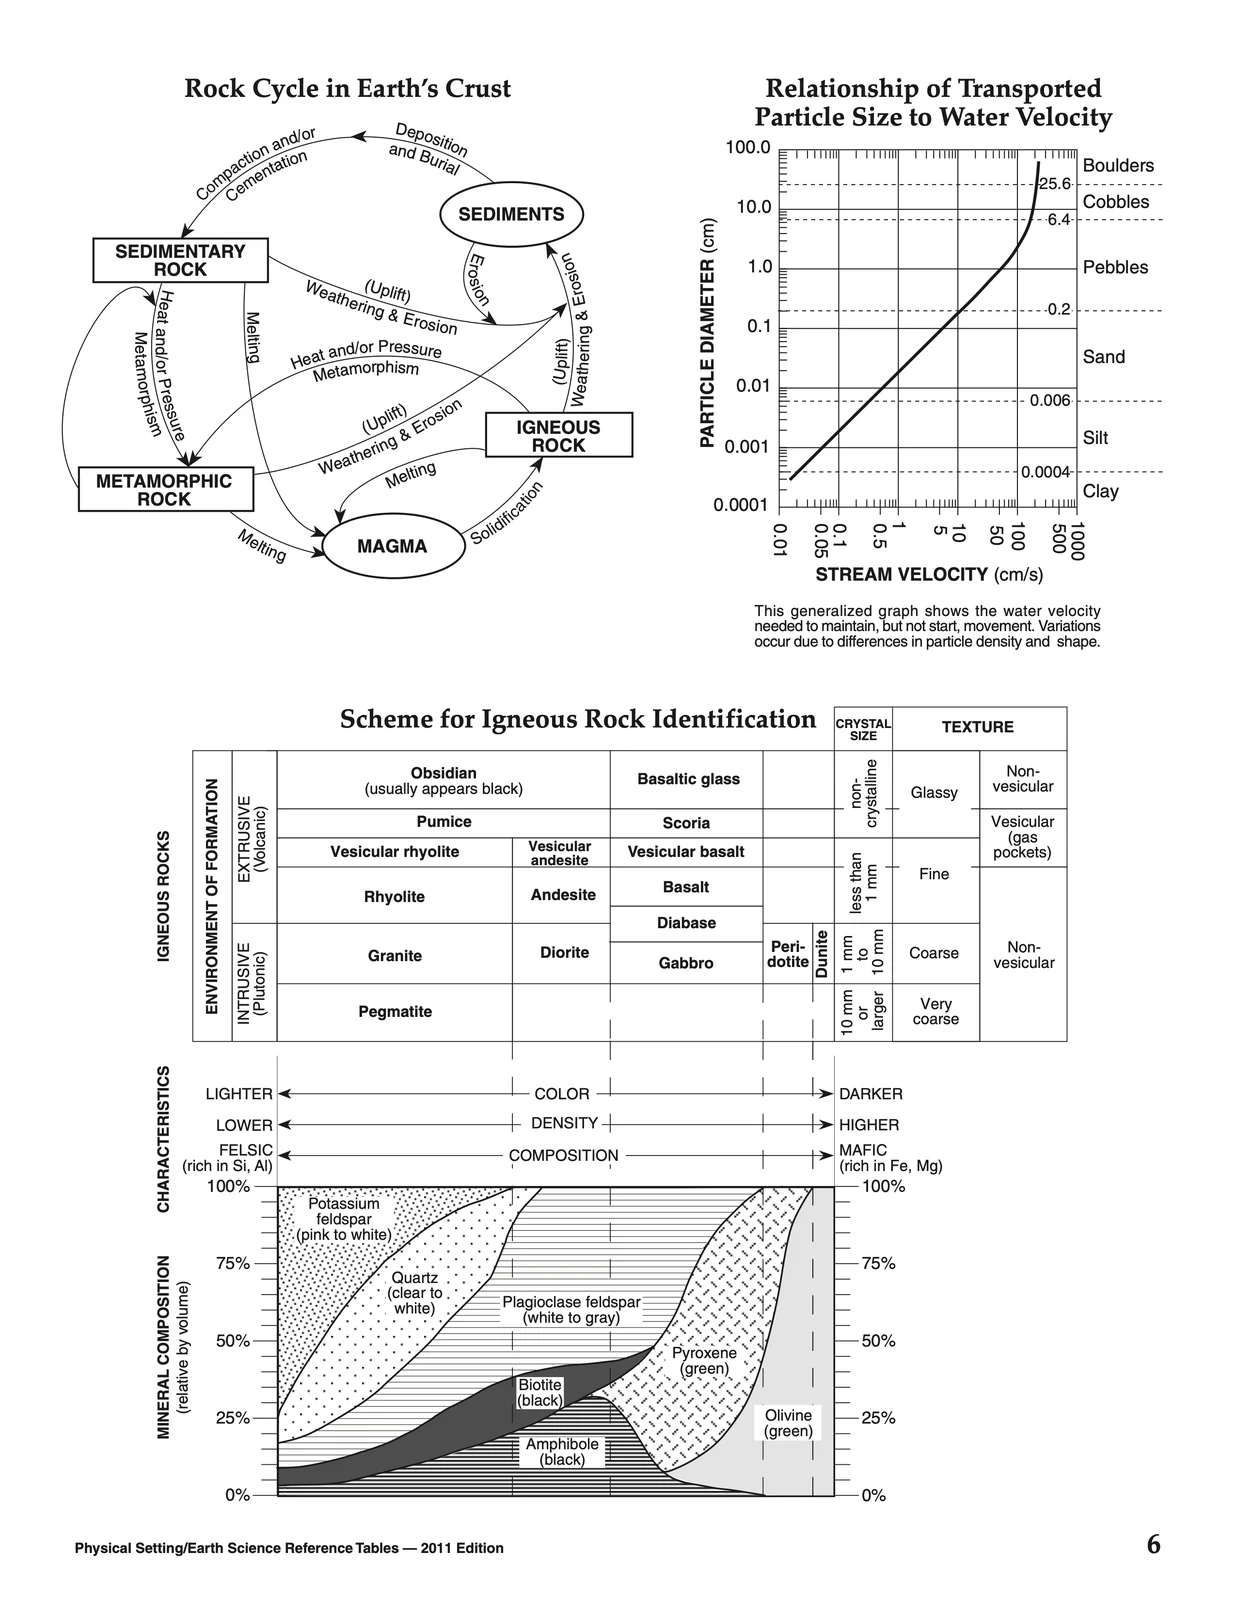
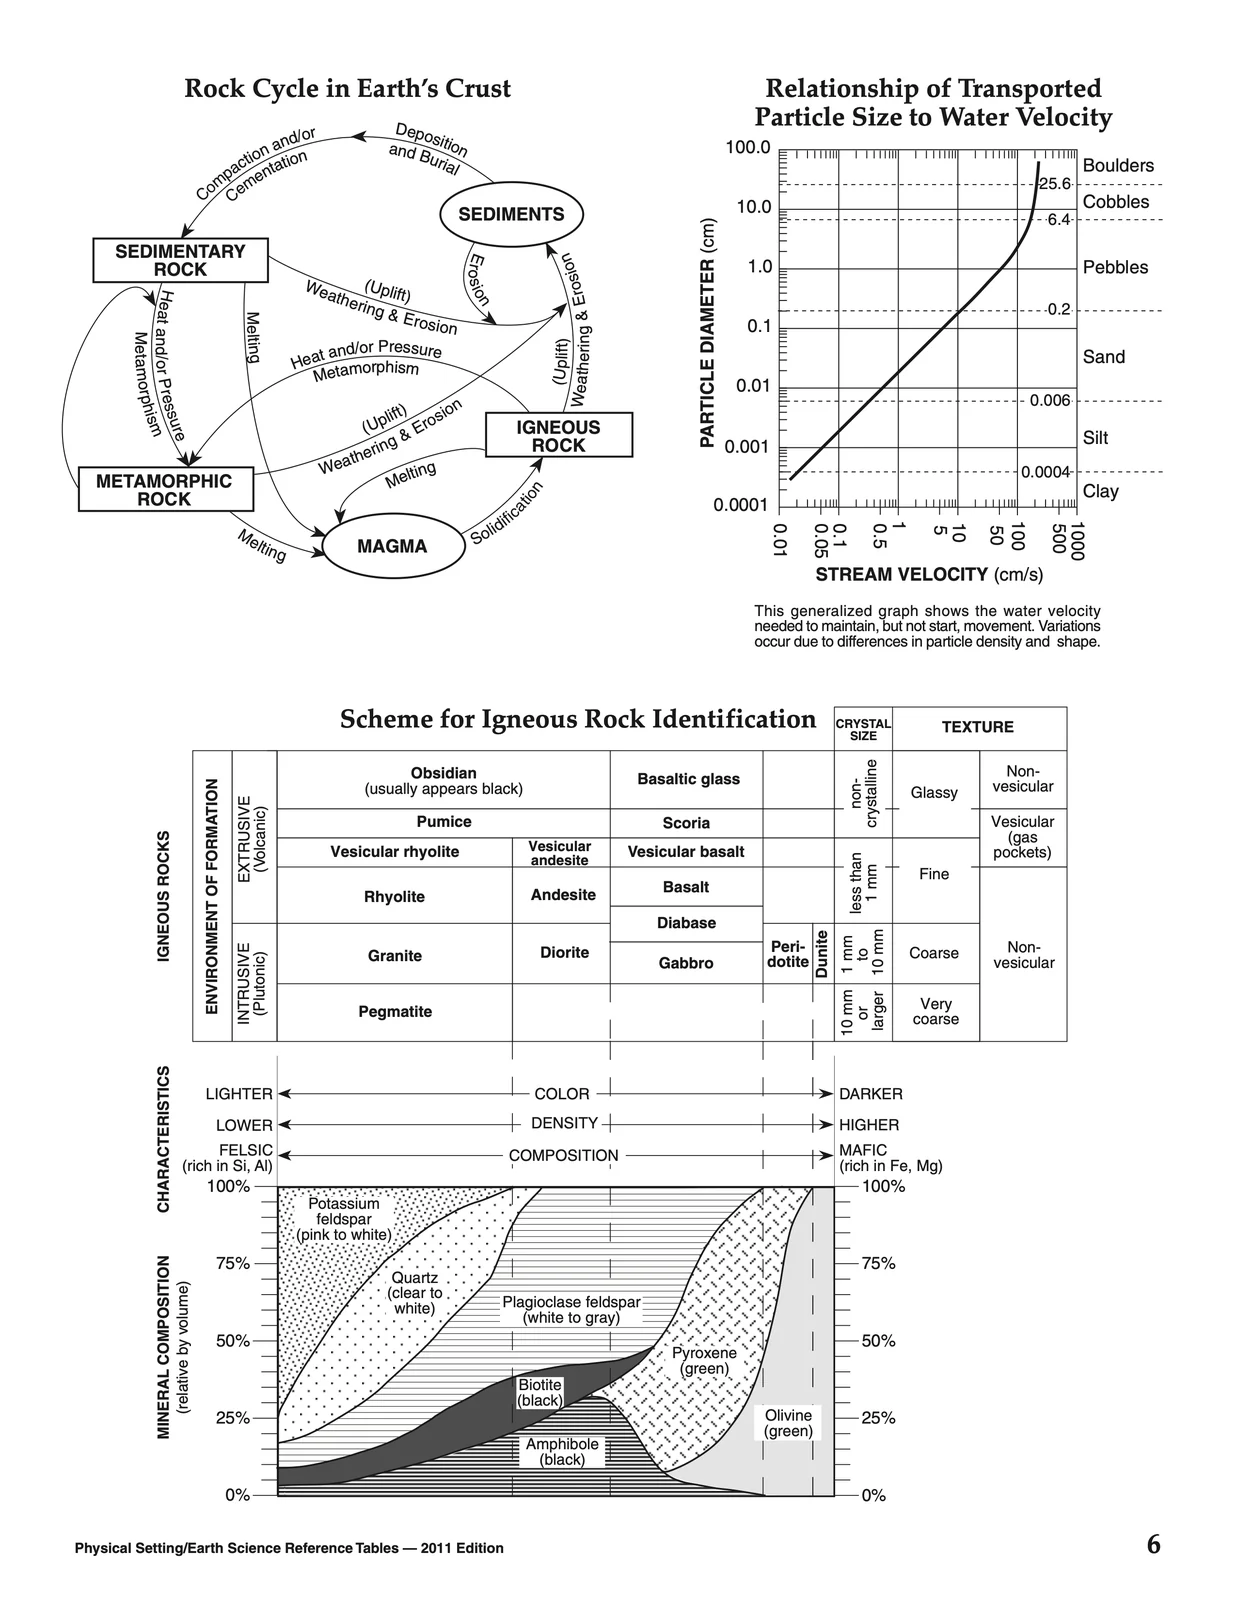
 Relationship of Transported Particle Size to Water Velocity
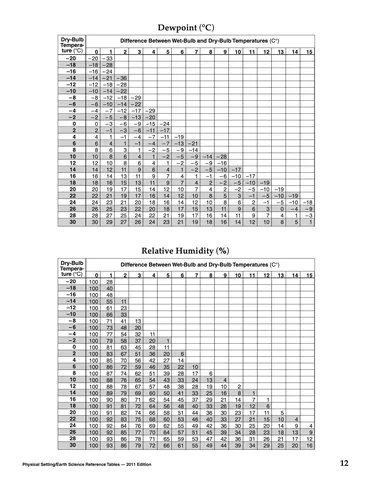 Relative Humidity
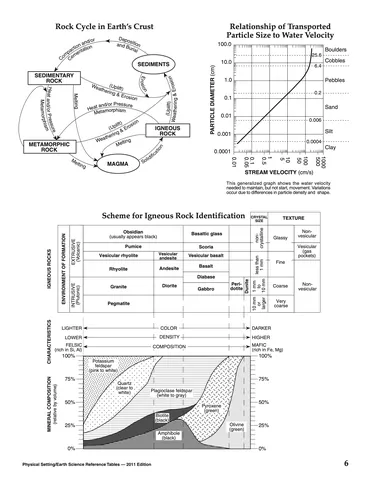 Rock Cycle in Earth's Crust
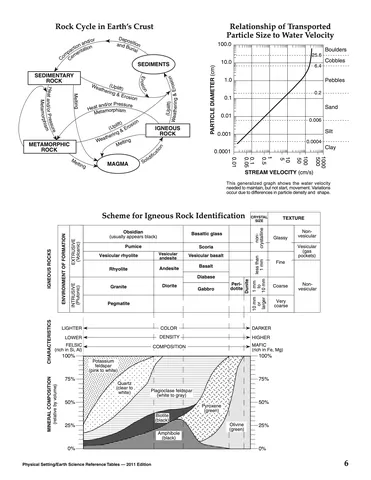 Scheme for Igneous Rock Identification
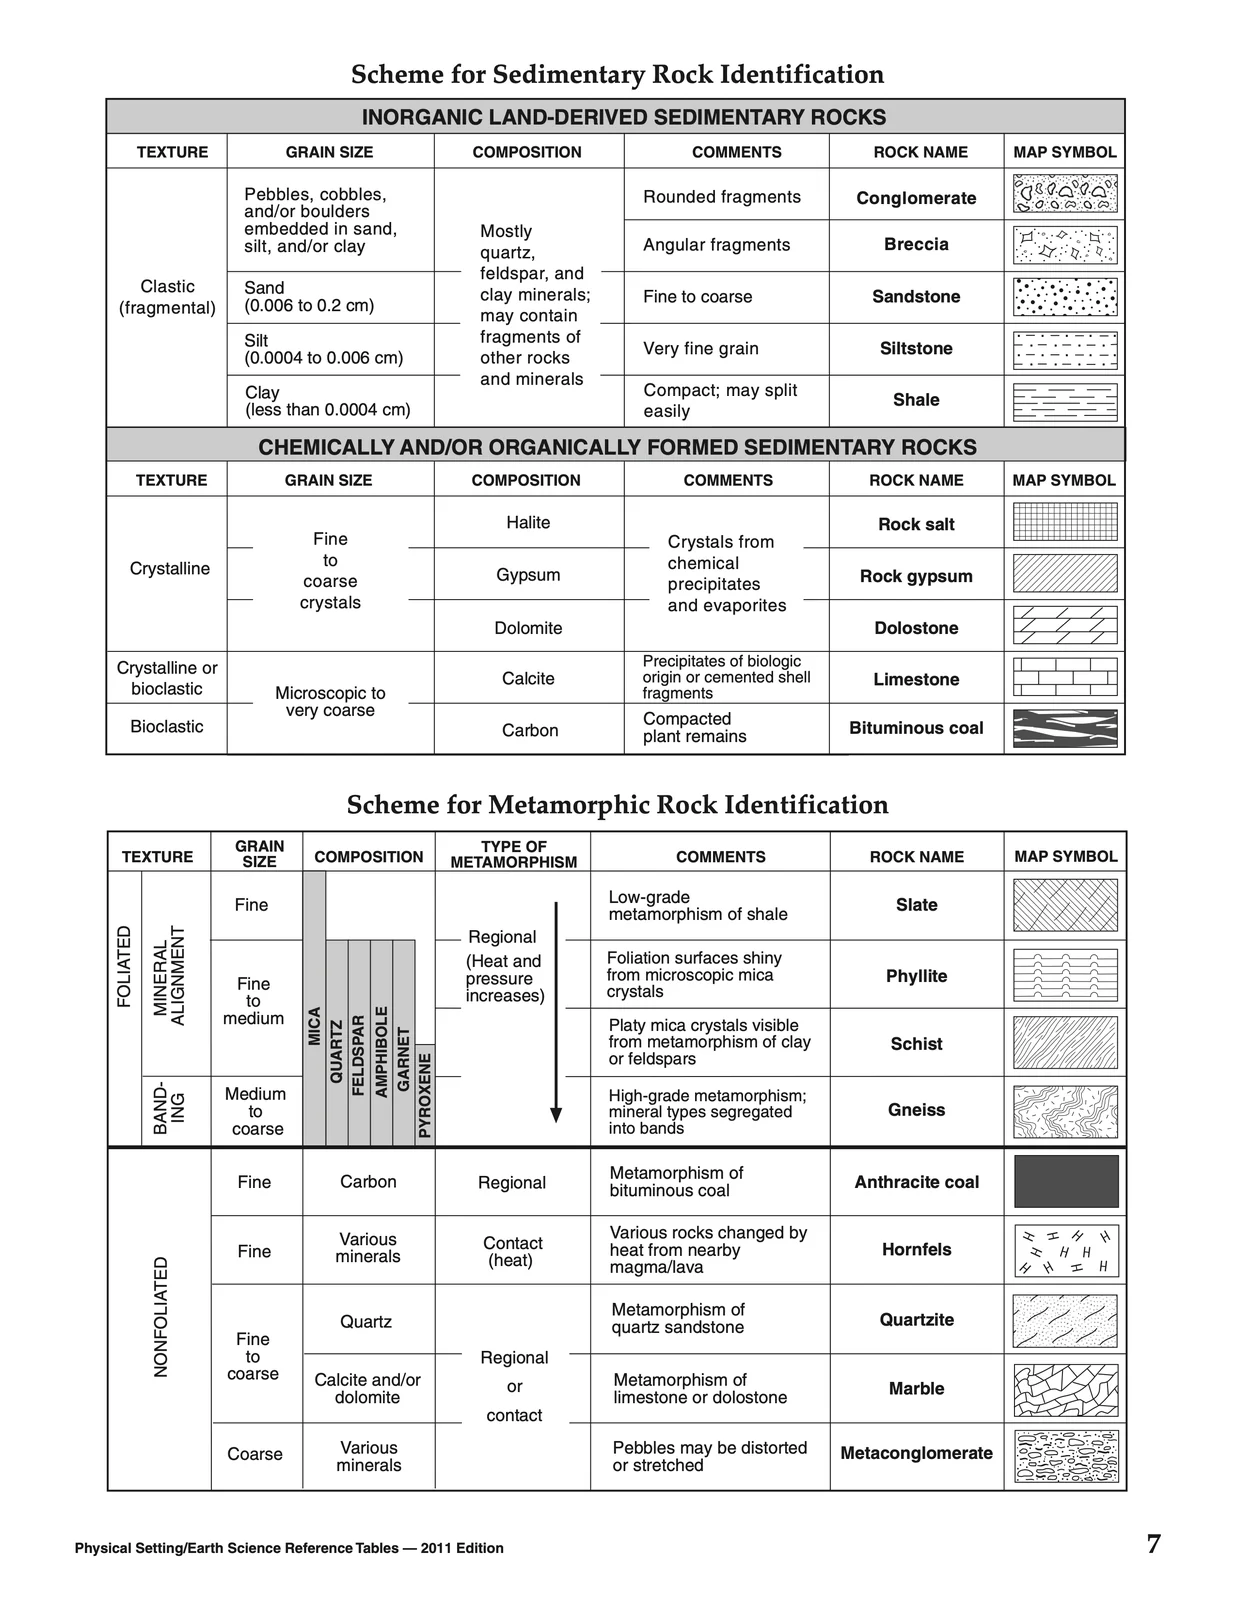
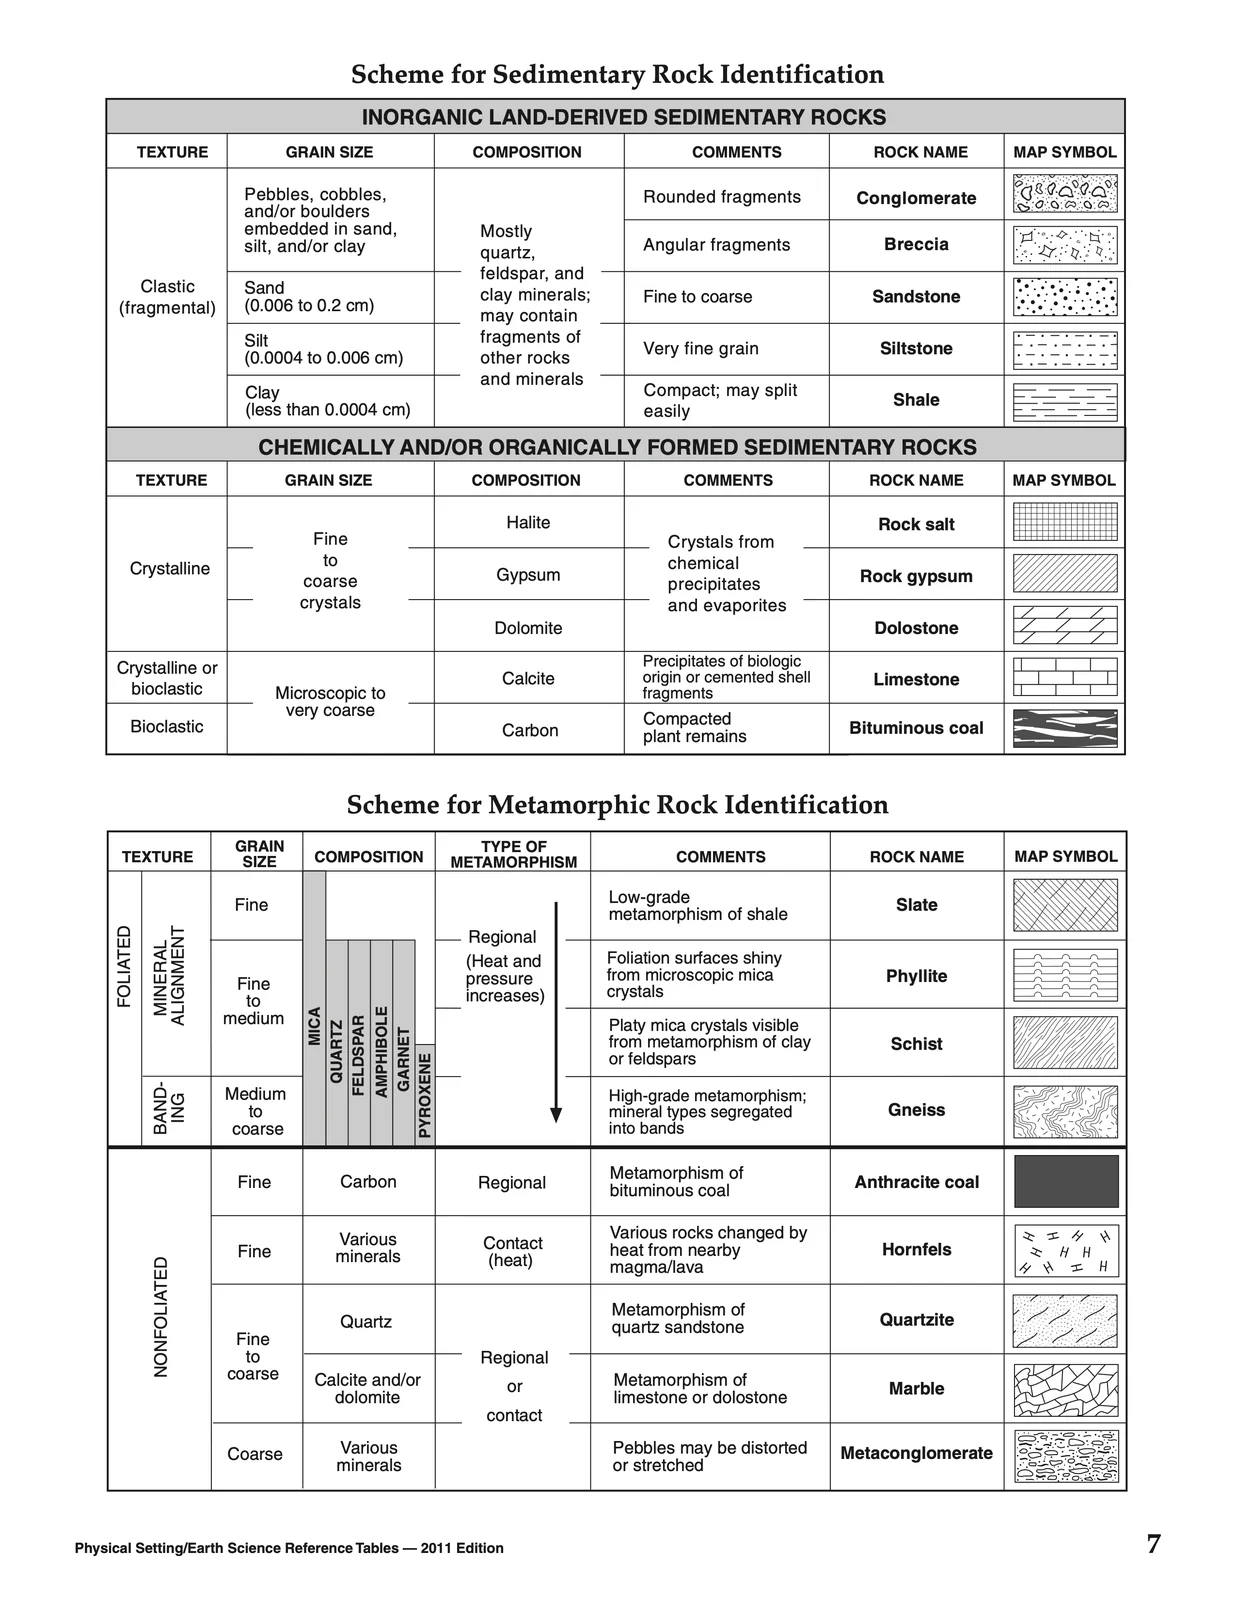
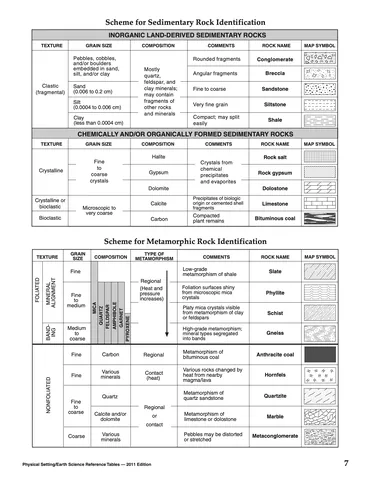 Scheme for Metamorphic Rock Identification
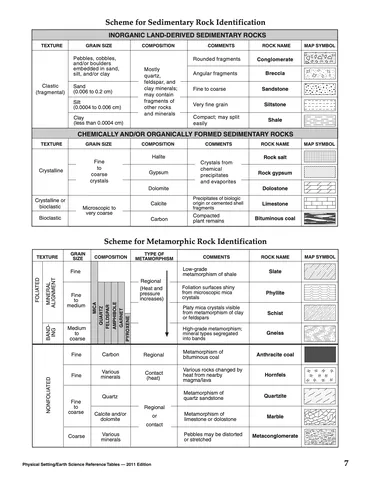 Scheme for Sedimentary Rock Identification
 Selected Properties of Earth's Atmosphere
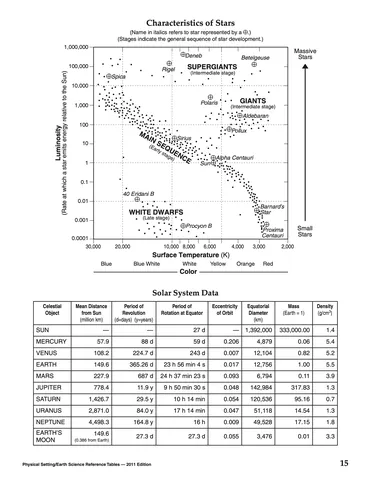 Solar System Data
 Specific Heats of Common Materials
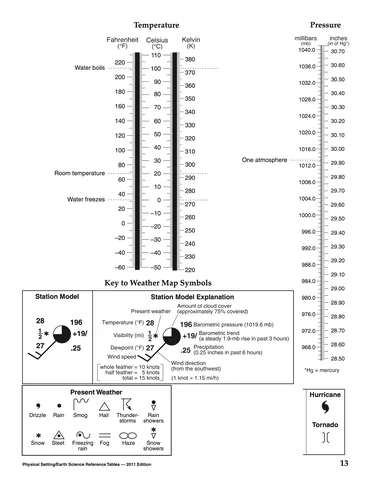 Station Model
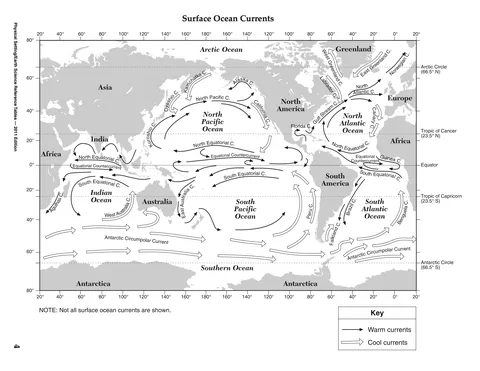 Surface Ocean Currents
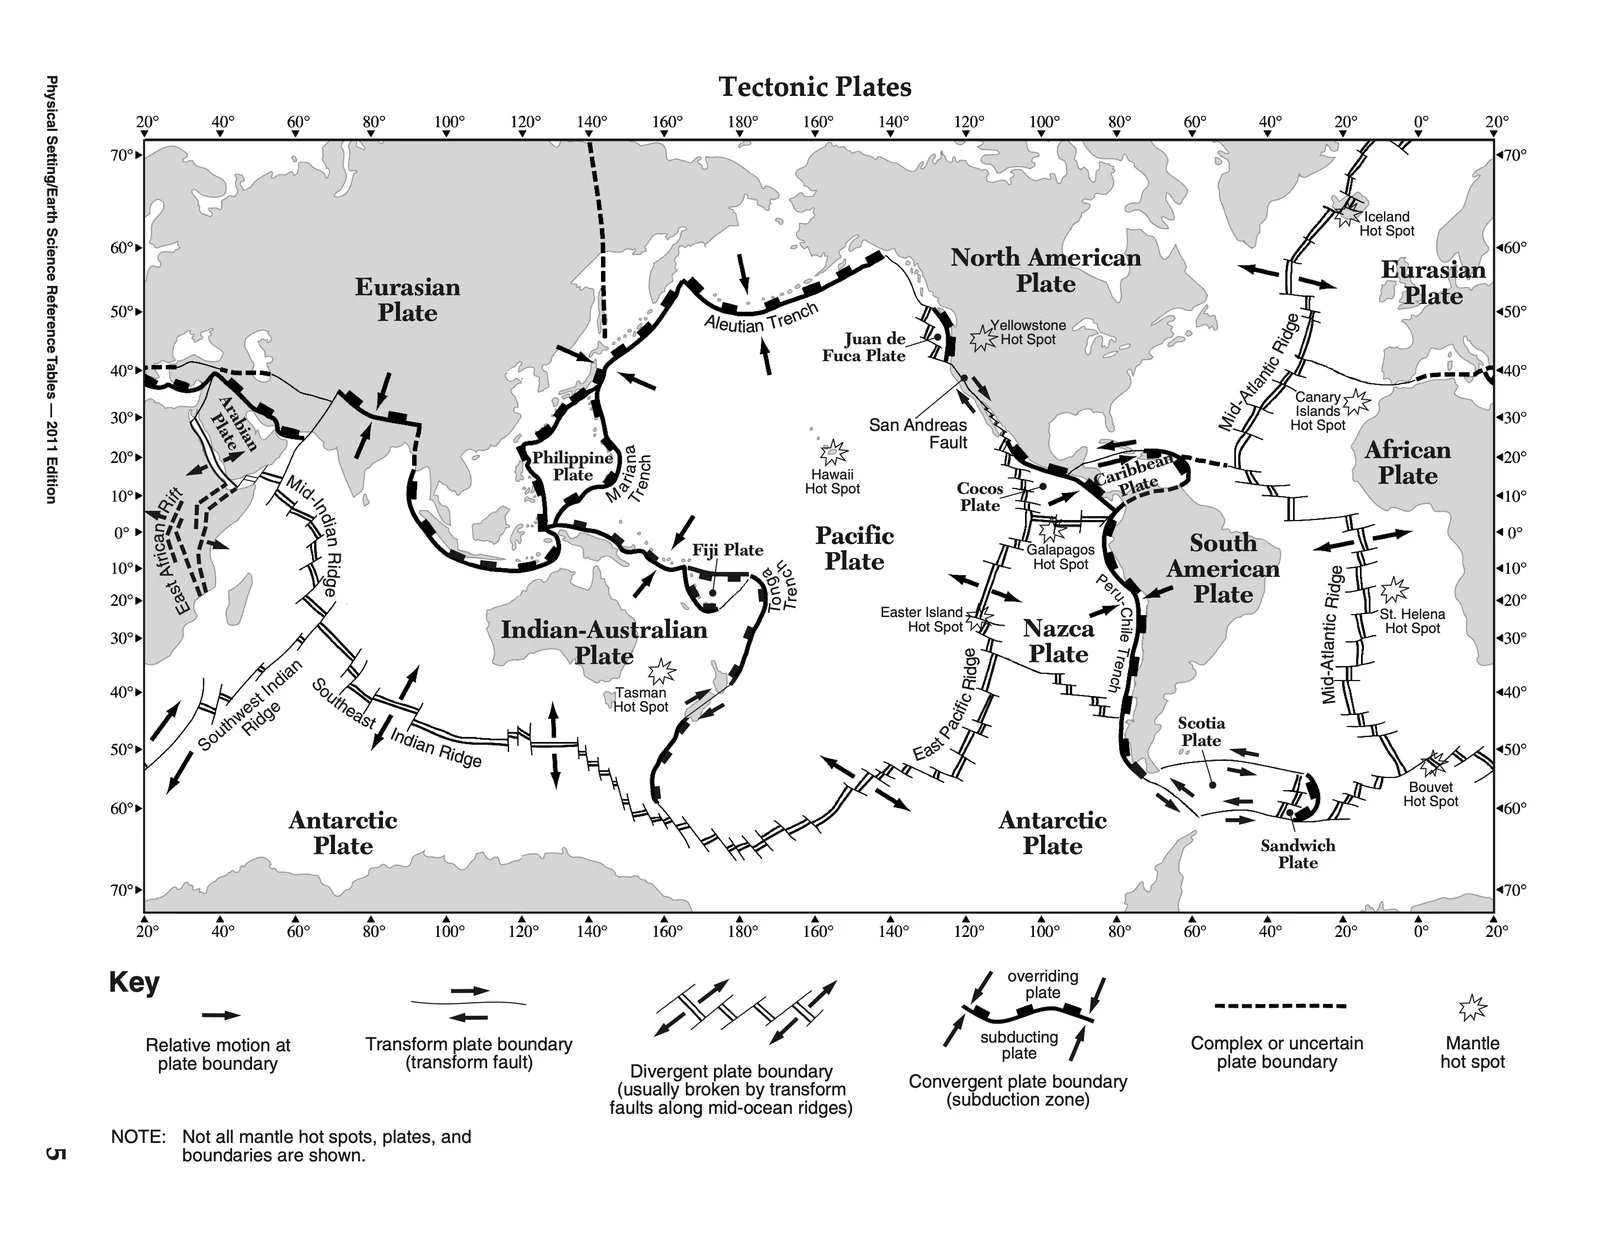
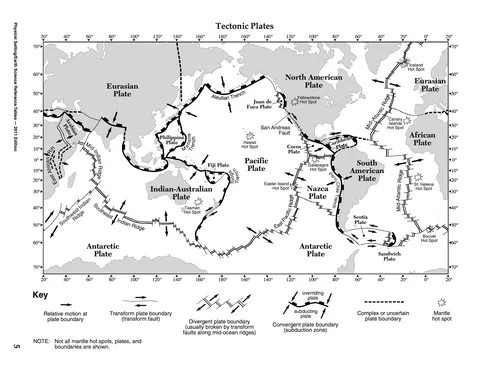 Tectonic Plates
 Temperature




















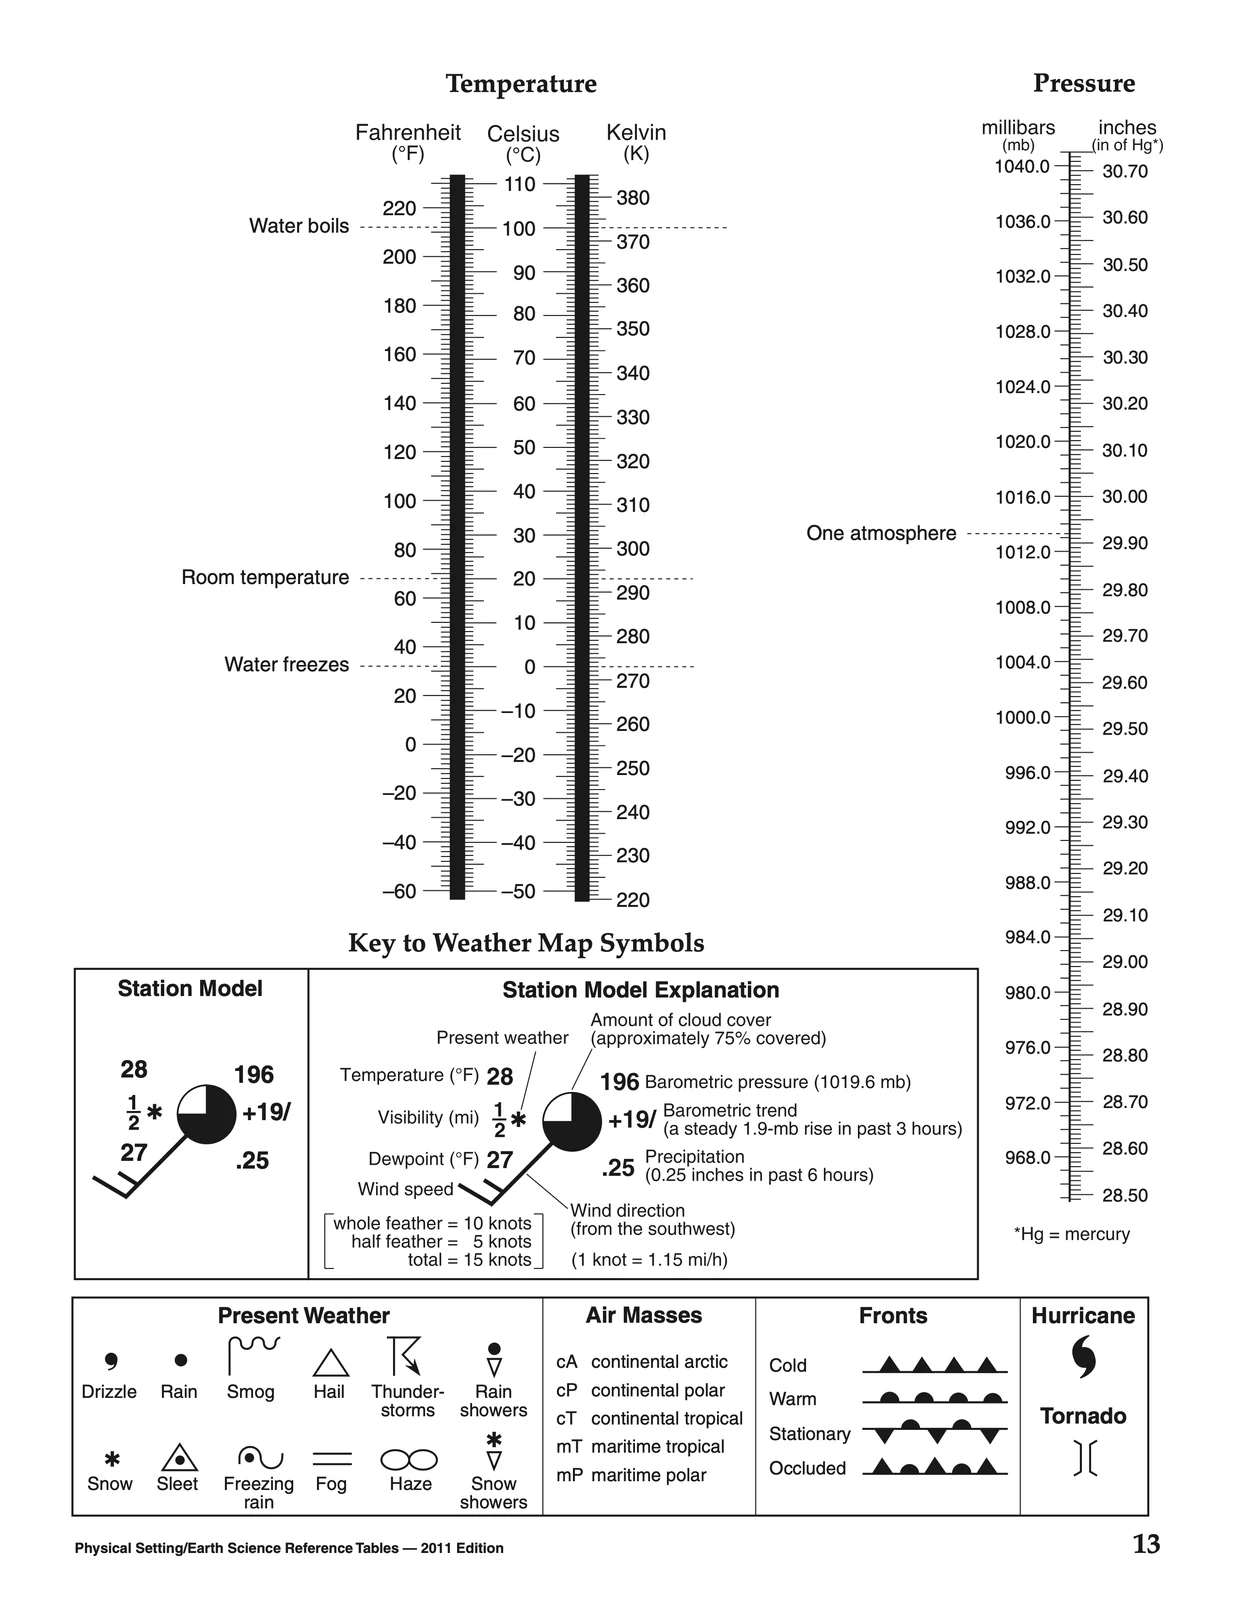
Source: New York State Education Department, public domain.
How to read each table
Short guides for the exam, one page at a time.
The formulas you now have to knowNot in the tables
Start here, because this is the biggest change. The older Earth Science tables opened with an equations page. The Reference Tables for Earth and Space Sciences do not. These formulas are still fair game on the exam, so they have to live in your head.
gradient = change in field value ÷ distancedensity = mass ÷ volumerate of change = change in value ÷ timeeccentricity = distance between foci ÷ length of major axispercent deviation = (difference from accepted ÷ accepted) × 100Elevation drops from 800 m to 500 m over 6 km. Find the gradient.
Change = 800 − 500 = 300 m. Distance = 6 km. Gradient = 300 ÷ 6 = 50 m/km.
An ellipse has foci 3 cm apart and a major axis of 10 cm. Find its eccentricity.
3 ÷ 10 = 0.3. Compare that with the Solar System Objects Data Table on page 2: Earth is 0.017, nearly a circle, and Mercury is 0.206.
Practice these in the gradient lab, the density lab, and the eccentricity lab.
Reading the solar system tablePage 2 · Solar System Objects Data Table
One table holds distance from the sun, period of revolution, period of rotation, orbital eccentricity, diameter, and axial tilt for every major body. Most solar system questions are lookups plus one comparison.
How to use it
- Find the row for the object.
- Read straight across to the column the question asks about.
- For a comparison, read two rows and subtract or divide.
Which planet has the most elliptical orbit, and how does Earth compare?
Read the eccentricity column. Among the planets, Mercury is highest at 0.206; Earth is 0.017, so Earth’s orbit is far closer to a circle. (Pluto, no longer counted as a planet, is higher still at 0.244.)
The Gravity and the Solar System chapter works from this table.
The H-R Diagram and how stars endPages 4 and 5 · H-R Diagram, Life Cycles of Stars
The H-R Diagram plots luminosity against surface temperature and sorts stars into families. Beside it is a key giving the temperature range of each spectral class, and page 5 models how stars of different masses live and die.
What to notice
- Temperature increases to the left, not the right. Blue O and B stars sit at the hot left edge; red M stars at the cool right.
- The main sequence runs diagonally from hot and bright down to cool and dim. Our sun sits on it.
- Giants and supergiants sit above the main sequence: cool but very luminous, because they are enormous.
- White dwarfs sit below: hot but dim, because they are tiny.
A star is red and far more luminous than the sun. Which family is it in?
Red means cool, so it sits to the right. High luminosity puts it well above the main sequence. That corner is the giants and supergiants, like Betelgeuse.
See it in the star color lab in Stars and the Universe.
The geologic time scalePages 6 and 7 · Geologic History of New York State
This two-page spread is the busiest in the booklet and the most rewarding. It carries the eras, periods, and epochs with their dates, the events in New York, index fossils and their time ranges, and small maps showing where Earth’s landmasses sat.
How to work it
- Find the time column first and locate the age or period in question.
- Read across for life on Earth, New York events, and the rock record.
- For a fossil question, find the fossil letter in the time distribution band and read the range it spans.
Eurypterids are abundant in New York rock of which period?
Follow the eurypterid band to where it is thickest and read the period column: the Silurian. Eurypterus remipes is the New York State fossil.
The Geologic History chapter builds on this spread.
The three New York mapsPages 8, 9, and 10 · New York State maps
Three maps in a row do most of the New York work on the exam, and they are meant to be read together.
- Page 8, Generalized Surface Bedrock Geology. Color gives the age and rock type of the bedrock. The oldest, Mesoproterozoic gneisses and marbles, are in the Adirondacks and the Hudson Highlands; the youngest, weakly consolidated gravels and sands, are on Long Island.
- Page 9, Energy and Mineral Resources. Where salt, gypsum, garnet, talc, iron, and the gas and oil fields are.
- Page 10, Geographic Province and Landscape Regions. The landscape regions, including the trap: the Catskills sit inside the Appalachian Plateau province.
A site has high elevation but flat-lying, undistorted bedrock. Which region type is it?
High plus horizontal bedrock means a plateau. On page 10 that is the Allegheny Plateau and the Catskills, which is why they are not called mountains.
The New York regions section in Landscapes walks all three maps.
The interior model and cross sectionPage 11 · Earth’s interior
Page 11 carries two models side by side: a layered model of Earth’s interior with depths and densities, and a cross section showing how that interior drives the surface.
Numbers worth knowing off this page
- Oceanic crust: about 5 to 15 km thick, near 3.0 g/cm³, basaltic.
- Continental crust: about 30 to 50 km thick, 2.7 to 2.9 g/cm³, granitic.
- The mantle reaches to 2900 km, where the fluid outer core begins.
- Density climbs with depth, reaching 12.8 to 13.1 g/cm³ in the solid inner core.
Why does oceanic crust subduct beneath continental crust?
Compare the densities on the page: oceanic is near 3.0 g/cm³, continental is 2.7 to 2.9. The denser oceanic plate sinks.
Explore it in the Earth interior visualization.
Half-life problemsPage 12 · Radiometric dating and hot spots
The radiometric dating table lists each parent isotope, its daughter product, its half-life, and what it can date. Below it, a world map marks selected hot spots.
after each half-life, half the remaining parent decaysHalf-lives to recognize
- Carbon-14 to nitrogen-14: 5730 years, good to about 70,000 years, for organic material.
- Uranium-238 to lead-206: 4.5 billion years, for zircon and other uranium minerals.
- Potassium-40 to argon-40: 1.3 billion years.
A bone contains one quarter of its original carbon-14. How old is it?
One quarter left means two half-lives have passed. 2 × 5730 = 11,460 years.
Why can carbon-14 not date a dinosaur bone?
Its useful range stops near 70,000 years, and dinosaurs died out 66 million years ago. You would need a slow clock like uranium-238.
Try the half-life lab, and see hot spots in Volcanoes.
Reading the plate mapPage 13 · Global Tectonic Activity
This world map shows plate boundaries, their type, the direction plates move, and spreading rates in centimeters per year.
How to read it
- Find the location and identify the nearest boundary.
- Read the key to classify it: divergent, convergent, or transform.
- At a convergent boundary, the symbol shows which plate overrides and which subducts.
- Numbers along divergent boundaries give the total spreading rate.
Which boundary type runs down the middle of the Atlantic, and what forms there?
The Mid-Atlantic Ridge is divergent. Plates separate and new basaltic ocean floor forms, which is why Iceland sits on it.
Classify boundaries yourself in the boundary explorer.
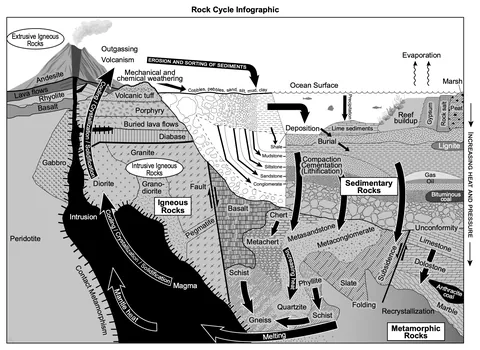
Igneous composition and the rock cyclePages 14 and 15 · Igneous rocks and the rock cycle
Page 14 pairs Bowen’s Reaction Series with the Mineral Composition of Igneous Rocks chart. Page 15 is a single large Rock Cycle Infographic that names rocks from all three families and shows where each forms.
The igneous chart
- Read left to right, felsic to intermediate to mafic to ultramafic.
- Felsic rocks (granite, rhyolite) are high in silica, light colored, and lower in density.
- Mafic rocks (gabbro, basalt) are richer in iron and magnesium, dark, and denser.
- Each pair names the intrusive rock and its extrusive twin: granite and rhyolite, gabbro and basalt.
Bowen’s Reaction Series
Minerals crystallize in order as magma cools, from olivine near 1400°C down to quartz near 650°C. The first minerals to crystallize are also the first to weather at the surface.
A rock is coarse-grained, light colored, and low in density. Name it.
Coarse grains mean it cooled slowly underground, so it is intrusive. Light and low density means felsic. That is granite.
Sort rocks in Rock Families and follow a path in the rock cycle journey.
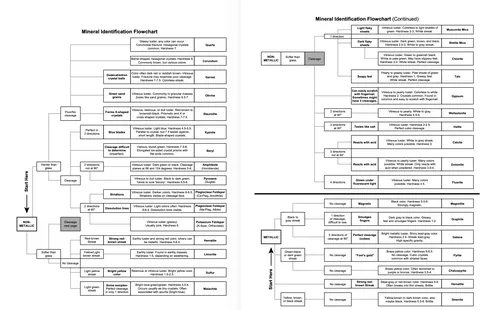
Following the mineral flowchartPages 16 and 17 · Mineral Identification Flowchart
This replaces the old properties chart, and it works differently: it is a decision tree you walk from the top, not a table you scan.
The path
- Start with luster: metallic or nonmetallic.
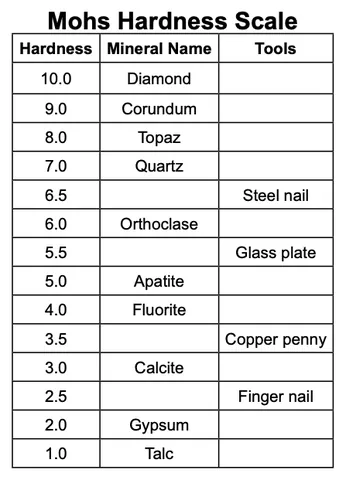
- Then hardness, using the Mohs scale printed on page 16: harder or softer than glass (5.5).
- Then cleavage: how many directions, and at what angles.
- Then the final clue: streak color, a reaction with acid, a soapy feel, magnetism, or taste.
A nonmetallic mineral is softer than glass, has cleavage in three directions not at 90°, and fizzes in acid. Name it.
Follow the branches: nonmetallic, softer than glass, three directions not at right angles, reacts with acid. That is calcite.
Which common mineral is harder than glass, has no cleavage, and shows conchoidal fracture?
Quartz, hardness 7.
Practice in the mineral ID lab.
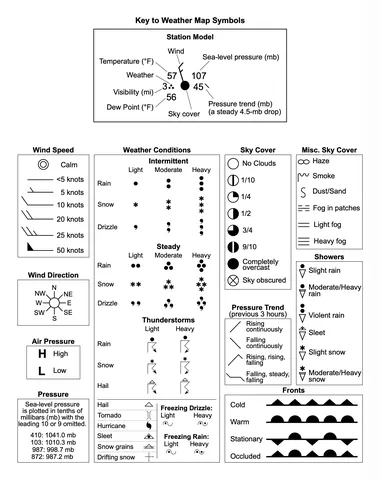
Decoding a station modelPage 18 · Key to Weather Map Symbols
Page 18 decodes everything on a weather map: the station model, wind speed and direction, sky cover, weather symbols, fronts, and pressure coding.
The two tricks worth drilling
- Pressure code. Sea-level pressure is printed in tenths of a millibar with the leading 10 or 9 dropped. Put a decimal before the last digit, then add 10 or 9, whichever lands in the realistic range of about 950 to 1050 mb. The page gives worked examples: 410 is 1041.0 mb and 872 is 987.2 mb.
- Wind. The staff points in the direction the wind is blowing from. Barbs give speed: a half barb is 5 knots, a full barb 10, a pennant 50.
A station model shows 103. What is the pressure?
Decimal before the last digit gives 10.3. Adding 9 gives 909.3, too low to be realistic. Adding 10 gives 1010.3 mb.
Decode real ones in the station model decoder.
Planetary circulationPages 19 and 20 · Wind belts, atmosphere, ocean currents
The last three models explain why climates sit where they do. Page 19 has the planetary wind belts and a cross section of the lower atmosphere; page 20 maps the surface ocean currents.
What to take from them
- Air rises at the equator (the Intertropical Convergence Zone), making it wet, and sinks near 30°, making the world’s great deserts.
- New York sits in the belt of prevailing westerlies, which is why weather generally arrives from the west.
- The troposphere holds our weather and thins from the equator toward the poles; the tropopause caps it, and jet streams run along it.
- Warm and cold currents are drawn separately on page 20. The Gulf Stream carries tropical warmth north past New York toward Europe.
Why do the world’s major deserts cluster near 30° north and south?
The wind belt model shows air descending at those latitudes. Sinking air warms and dries, so little rain falls.
Test the factors in the climate lab.